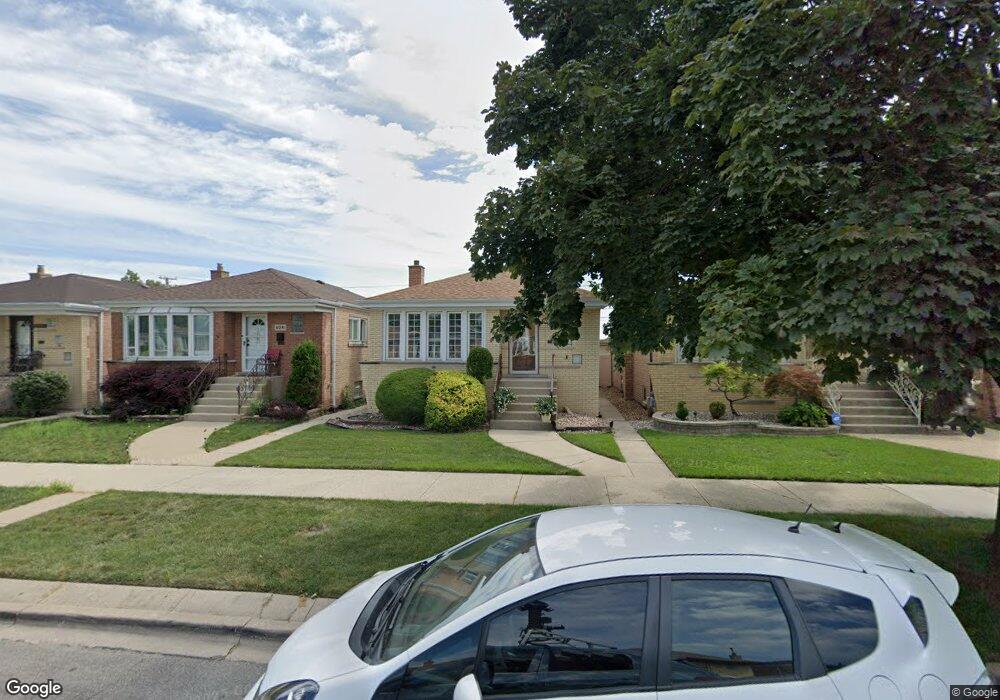
6043 S Parkside Ave Chicago, IL 60638
Clearing NeighborhoodEstimated Value: $263,000 - $359,000
2
Beds
1
Bath
1,059
Sq Ft
$301/Sq Ft
Est. Value
About This Home
This home is located at 6043 S Parkside Ave, Chicago, IL 60638 and is currently estimated at $319,197, approximately $301 per square foot. 6043 S Parkside Ave is a home located in Cook County with nearby schools including Hale Elementary School, Kennedy High School, and St. Symphorosa Catholic School.
Ownership History
Date
Name
Owned For
Owner Type
Purchase Details
Closed on
Oct 12, 2018
Sold by
Ginino John P
Bought by
Ginino Barbara
Current Estimated Value
Purchase Details
Closed on
Mar 29, 2000
Sold by
Harris Leonard and Major Harris Monica
Bought by
Ginino John
Home Financials for this Owner
Home Financials are based on the most recent Mortgage that was taken out on this home.
Original Mortgage
$135,000
Interest Rate
8.29%
Purchase Details
Closed on
Nov 13, 1996
Sold by
Catizone Anthony J and Catizone Barbara L
Bought by
Harris Leonard and Major Harris Monica
Home Financials for this Owner
Home Financials are based on the most recent Mortgage that was taken out on this home.
Original Mortgage
$125,000
Interest Rate
7.74%
Create a Home Valuation Report for This Property
The Home Valuation Report is an in-depth analysis detailing your home's value as well as a comparison with similar homes in the area
Home Values in the Area
Average Home Value in this Area
Purchase History
| Date | Buyer | Sale Price | Title Company |
|---|---|---|---|
| Ginino Barbara | $220,000 | None Listed On Document | |
| Ginino John | $150,000 | -- | |
| Harris Leonard | $132,000 | -- |
Source: Public Records
Mortgage History
| Date | Status | Borrower | Loan Amount |
|---|---|---|---|
| Previous Owner | Ginino John | $135,000 | |
| Previous Owner | Harris Leonard | $125,000 |
Source: Public Records
Tax History Compared to Growth
Tax History
| Year | Tax Paid | Tax Assessment Tax Assessment Total Assessment is a certain percentage of the fair market value that is determined by local assessors to be the total taxable value of land and additions on the property. | Land | Improvement |
|---|---|---|---|---|
| 2024 | $3,964 | $27,000 | $5,292 | $21,708 |
| 2023 | $3,843 | $22,000 | $4,725 | $17,275 |
| 2022 | $3,843 | $22,000 | $4,725 | $17,275 |
| 2021 | $3,754 | $22,000 | $4,725 | $17,275 |
| 2020 | $3,527 | $18,833 | $3,780 | $15,053 |
| 2019 | $3,538 | $20,926 | $3,780 | $17,146 |
| 2018 | $3,477 | $20,926 | $3,780 | $17,146 |
| 2017 | $3,159 | $17,953 | $3,402 | $14,551 |
| 2016 | $3,116 | $17,953 | $3,402 | $14,551 |
| 2015 | $2,830 | $17,953 | $3,402 | $14,551 |
| 2014 | $2,494 | $15,905 | $3,213 | $12,692 |
| 2013 | $2,434 | $15,905 | $3,213 | $12,692 |
Source: Public Records
Map
Nearby Homes
- 6129 S Parkside Ave
- 6025 S Major Ave
- 6058 S Massasoit Ave
- 6005 S Menard Ave
- 5533 W 63rd Place
- 6016 S Mayfield Ave
- 6037 S Mason Ave
- 5814 S Massasoit Ave
- 5631 W 64th Place
- 5817 W 64th St
- 6152 S Austin Ave
- 5749 W 64th Place
- 5819 S Mason Ave
- 5740 S Monitor Ave
- 6403 S Lorel Ave
- 5827 S Austin Ave
- 6123 S Meade Ave
- 6334 S Austin Ave
- 5810 S Austin Ave
- 6155 S Moody Ave
- 6041 S Parkside Ave
- 6035 S Parkside Ave
- 6047 S Parkside Ave
- 6031 S Parkside Ave
- 6049 S Parkside Ave
- 6029 S Parkside Ave
- 6053 S Parkside Ave
- 6036 S Central Ave
- 6025 S Parkside Ave
- 6055 S Parkside Ave
- 6034 S Central Ave
- 6048 S Central Ave
- 6050 S Central Ave
- 6023 S Parkside Ave
- 6040 S Parkside Ave
- 6042 S Parkside Ave
- 6036 S Parkside Ave
- 6052 S Central Ave
- 6046 S Parkside Ave
- 6034 S Parkside Ave