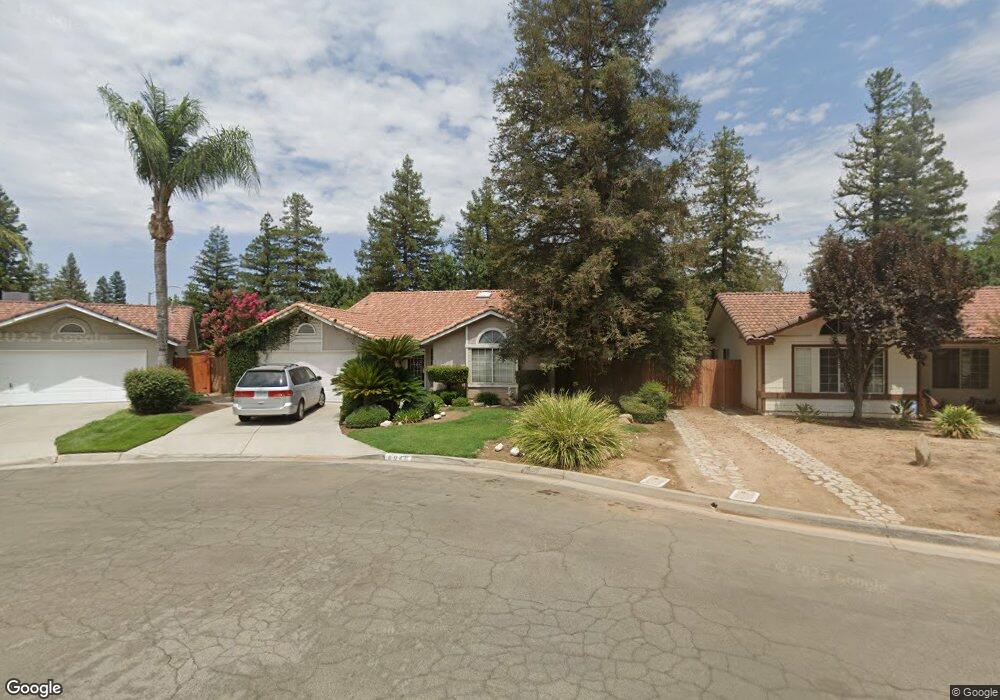
6046 W Locust Ave Fresno, CA 93722
Sierra Sky Park NeighborhoodEstimated Value: $370,000 - $425,000
3
Beds
2
Baths
1,220
Sq Ft
$324/Sq Ft
Est. Value
About This Home
This home is located at 6046 W Locust Ave, Fresno, CA 93722 and is currently estimated at $394,951, approximately $323 per square foot. 6046 W Locust Ave is a home located in Fresno County with nearby schools including River Bluff Elementary School and Rio Vista Middle School.
Ownership History
Date
Name
Owned For
Owner Type
Purchase Details
Closed on
Jul 2, 2018
Sold by
Fauntleroy Lyn
Bought by
Fauntleroy Lyn and Fauntleroy Kathryn
Current Estimated Value
Purchase Details
Closed on
Nov 23, 2011
Sold by
Fauntleroy Lyn
Bought by
Fauntleroy Lyn and Fauntleroy Kathryn
Home Financials for this Owner
Home Financials are based on the most recent Mortgage that was taken out on this home.
Original Mortgage
$105,000
Outstanding Balance
$71,738
Interest Rate
4.06%
Mortgage Type
New Conventional
Estimated Equity
$323,213
Purchase Details
Closed on
Apr 22, 2003
Sold by
Fauntleroy Katie
Bought by
Fauntleroy Lynn
Home Financials for this Owner
Home Financials are based on the most recent Mortgage that was taken out on this home.
Original Mortgage
$135,920
Interest Rate
5.71%
Purchase Details
Closed on
Apr 21, 2003
Sold by
Mather Mark A and Mather Laura A
Bought by
Fauntleroy Lyn
Home Financials for this Owner
Home Financials are based on the most recent Mortgage that was taken out on this home.
Original Mortgage
$135,920
Interest Rate
5.71%
Create a Home Valuation Report for This Property
The Home Valuation Report is an in-depth analysis detailing your home's value as well as a comparison with similar homes in the area
Home Values in the Area
Average Home Value in this Area
Purchase History
| Date | Buyer | Sale Price | Title Company |
|---|---|---|---|
| Fauntleroy Lyn | -- | None Available | |
| Fauntleroy Lyn | -- | Placer Title Company | |
| Fauntleroy Lynn | -- | Fidelity National Title Co | |
| Fauntleroy Lyn | $170,000 | Fidelity National Title Co |
Source: Public Records
Mortgage History
| Date | Status | Borrower | Loan Amount |
|---|---|---|---|
| Open | Fauntleroy Lyn | $105,000 | |
| Closed | Fauntleroy Lyn | $135,920 |
Source: Public Records
Tax History Compared to Growth
Tax History
| Year | Tax Paid | Tax Assessment Tax Assessment Total Assessment is a certain percentage of the fair market value that is determined by local assessors to be the total taxable value of land and additions on the property. | Land | Improvement |
|---|---|---|---|---|
| 2025 | $3,135 | $244,743 | $72,403 | $172,340 |
| 2023 | $3,061 | $235,242 | $69,593 | $165,649 |
| 2022 | $2,891 | $230,630 | $68,229 | $162,401 |
| 2021 | $2,912 | $226,109 | $66,892 | $159,217 |
| 2020 | $2,772 | $223,792 | $66,207 | $157,585 |
| 2019 | $2,730 | $219,405 | $64,909 | $154,496 |
| 2018 | $2,668 | $215,104 | $63,637 | $151,467 |
| 2017 | $2,678 | $210,888 | $62,390 | $148,498 |
| 2016 | $2,471 | $206,754 | $61,167 | $145,587 |
| 2015 | $2,443 | $202,200 | $59,700 | $142,500 |
| 2014 | $2,338 | $189,400 | $55,900 | $133,500 |
Source: Public Records
Map
Nearby Homes
- 5989 W Turtle Bay Dr
- 5838 W Fallon Ave
- 6203 W Chennault Ave
- 7005 N Astoria Dr
- 6001 W Alluvial Ave
- 7195 N Carnegie Ave
- 5804 W Chennault Ave
- 5802 W Millbrae Ave
- 7568 N Hanna Ave
- 5908 W Fremont Ave
- 5811 W Cromwell Ave
- 6675 N Lola Ave
- 6646 W Beechwood Ave
- 6671 N Sandrini Ave
- 7141 N Shiraz Ave
- 6753 W Beechwood Ave
- 6712 W Lucas Dr
- 6075 W Menlo Ave
- 5807 W Paul Ave
- 6760 Lucas Dr
- 6034 W Locust Ave
- 6056 W Locust Ave
- 7199 N Bain Ave
- 6024 W Locust Ave
- 7187 N Bain Ave
- 6035 W Locust Ave
- 6014 W Locust Ave
- 6053 W Birch Ave
- 6063 W Birch Ave
- 6041 W Birch Ave
- 6023 W Locust Ave
- 6075 W Birch Ave
- 7175 N Bain Ave
- 6031 W Birch Ave
- 6002 W Locust Ave
- 6013 W Locust Ave
- 6036 W Fallon Ave
- 6019 W Birch Ave
- 7163 N Bain Ave
- 6024 W Fallon Ave