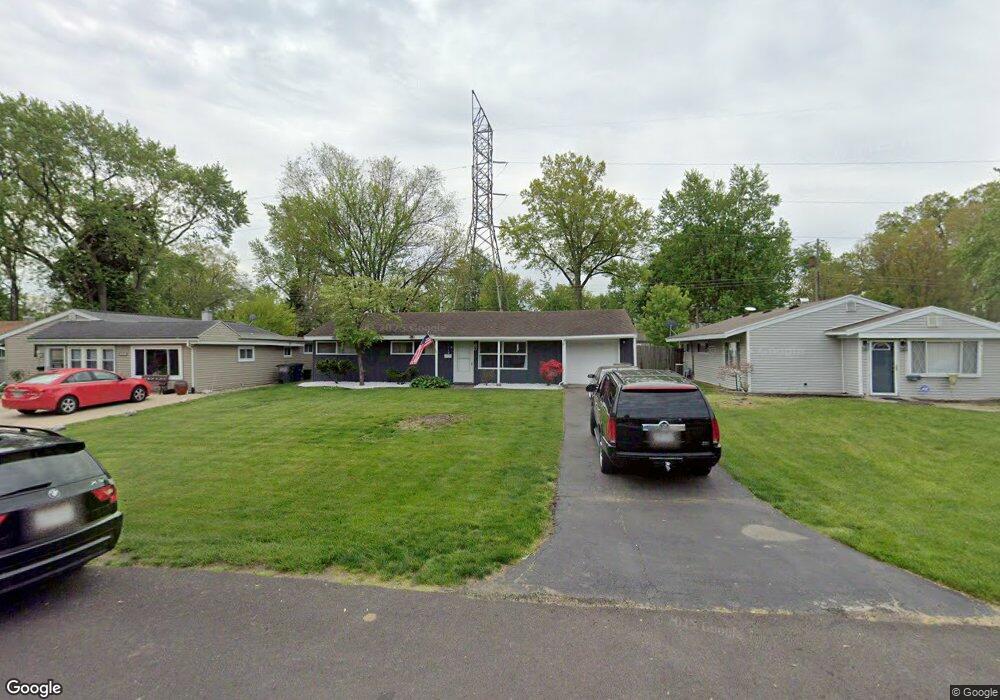
6048 Atwell Rd Toledo, OH 43613
Whitmer-Trilby NeighborhoodEstimated Value: $159,000 - $189,740
3
Beds
2
Baths
1,570
Sq Ft
$114/Sq Ft
Est. Value
About This Home
This home is located at 6048 Atwell Rd, Toledo, OH 43613 and is currently estimated at $178,935, approximately $113 per square foot. 6048 Atwell Rd is a home located in Lucas County with nearby schools including Meadowvale Elementary School, Washington Junior High School, and Jefferson Junior High School.
Ownership History
Date
Name
Owned For
Owner Type
Purchase Details
Closed on
Jan 26, 2017
Sold by
Long Kristin L Berger and Long Gary N
Bought by
Swisher Jonathan M and Swisher Jonathon A
Current Estimated Value
Home Financials for this Owner
Home Financials are based on the most recent Mortgage that was taken out on this home.
Original Mortgage
$60,000
Outstanding Balance
$49,340
Interest Rate
4.3%
Mortgage Type
New Conventional
Estimated Equity
$129,595
Purchase Details
Closed on
Dec 19, 2012
Sold by
Long Gary N and Berger Long Kristi L
Bought by
Swisher Joathon A
Purchase Details
Closed on
May 31, 2006
Sold by
Long Kristi L Berger and Long Gary N
Bought by
Long Gary N and Long Kristi L Berger
Purchase Details
Closed on
May 18, 2006
Sold by
Long Kristi L Berger
Bought by
Long Kristi L Berger
Purchase Details
Closed on
Mar 15, 1998
Sold by
Berger Jeanne S
Bought by
Berger Jeanne S
Purchase Details
Closed on
Jul 27, 1989
Sold by
Berger Robert J and Berger Jeanne
Create a Home Valuation Report for This Property
The Home Valuation Report is an in-depth analysis detailing your home's value as well as a comparison with similar homes in the area
Home Values in the Area
Average Home Value in this Area
Purchase History
We collect this data history from publicly available records. To have your information removed, we recommend requesting removal directly through your county’s website.
| Date | Buyer | Sale Price | Title Company |
|---|---|---|---|
| Swisher Jonathan M | $92,000 | None Available | |
| Swisher Jonathan M | $91,500 | None Available | |
| Swisher Joathon A | $92,000 | None Available | |
| Long Gary N | -- | None Available | |
| Long Kristi L Berger | $77,000 | None Available | |
| Berger Jeanne S | -- | -- | |
| -- | -- | -- |
Source: Public Records
Mortgage History
We collect this data history from publicly available records. To have your information removed, we recommend requesting removal directly through your county’s website.
| Date | Status | Borrower | Loan Amount |
|---|---|---|---|
| Open | Swisher Jonathan M | $60,000 |
Source: Public Records
Tax History
| Year | Tax Paid | Tax Assessment Tax Assessment Total Assessment is a certain percentage of the fair market value that is determined by local assessors to be the total taxable value of land and additions on the property. | Land | Improvement |
|---|---|---|---|---|
| 2025 | -- | $51,800 | $9,170 | $42,630 |
| 2024 | $1,611 | $51,800 | $9,170 | $42,630 |
| 2023 | $2,569 | $34,615 | $7,280 | $27,335 |
| 2022 | $2,543 | $34,615 | $7,280 | $27,335 |
| 2021 | $2,609 | $34,615 | $7,280 | $27,335 |
| 2020 | $2,579 | $29,190 | $6,160 | $23,030 |
| 2019 | $2,488 | $29,190 | $6,160 | $23,030 |
| 2018 | $2,326 | $29,190 | $6,160 | $23,030 |
| 2017 | $2,347 | $28,525 | $5,215 | $23,310 |
| 2016 | $2,352 | $81,500 | $14,900 | $66,600 |
| 2015 | $2,372 | $81,500 | $14,900 | $66,600 |
| 2014 | $1,944 | $28,530 | $5,220 | $23,310 |
| 2013 | $1,944 | $28,530 | $5,220 | $23,310 |
Source: Public Records
Map
Nearby Homes
- 5835 Deane Dr
- 2831 E Glenn St
- 3125 Brock Dr
- 3334 Thelma Dr
- 6079 Whiteford Center Rd
- 2657 W Alexis Rd
- 6220 Whiteford Center Rd
- 5608 Pawnee Rd
- 5601 Pawnee Rd
- 5555 Gay St
- 5845 Douglas Rd
- 3420 Coral Ave
- 5646 Planet Ave
- 3412 Birchdale Dr
- 5505 Chippewa Rd
- 5933 Acoma Dr
- 2741 Lyceum Place
- 2342 Dellwood Dr
- 5540 Douglas Rd
- 5536 Douglas Rd
Your Personal Tour Guide
Ask me questions while you tour the home.