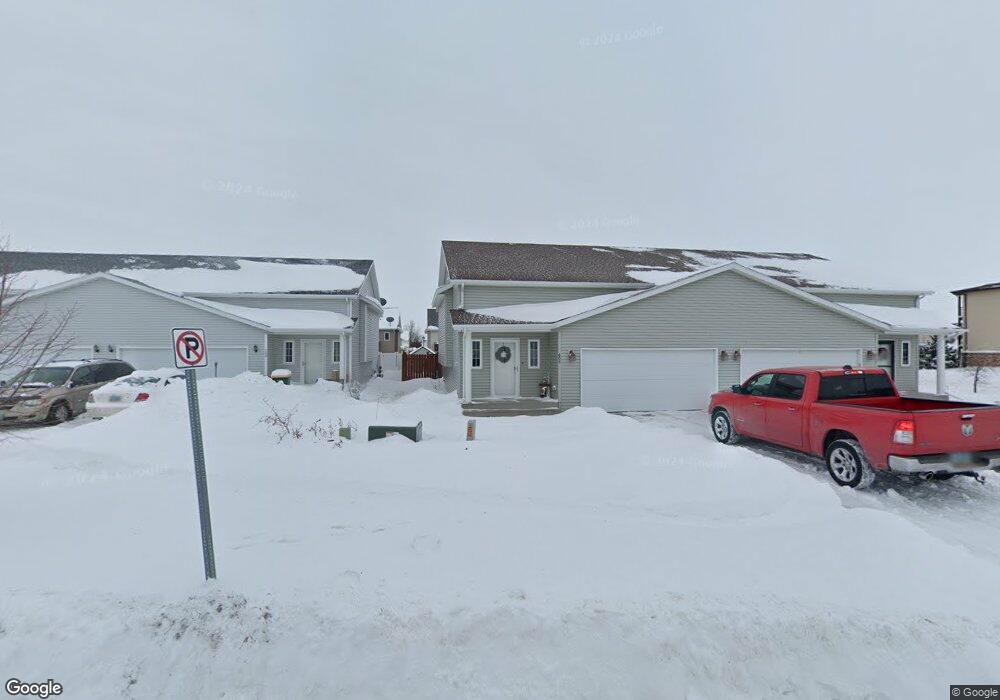
605 13 1/2 Ave E West Fargo, ND 58078
Charleswood NeighborhoodEstimated Value: $256,000 - $264,000
3
Beds
2
Baths
1,842
Sq Ft
$142/Sq Ft
Est. Value
About This Home
This home is located at 605 13 1/2 Ave E, West Fargo, ND 58078 and is currently estimated at $261,429, approximately $141 per square foot. 605 13 1/2 Ave E is a home located in Cass County with nearby schools including South Elementary School, Cheney Middle School, and West Fargo High School.
Ownership History
Date
Name
Owned For
Owner Type
Purchase Details
Closed on
May 23, 2025
Sold by
Viessman Brian
Bought by
Droogsma Mitchell J and Droogsma Amanda
Current Estimated Value
Home Financials for this Owner
Home Financials are based on the most recent Mortgage that was taken out on this home.
Original Mortgage
$175,000
Outstanding Balance
$174,377
Interest Rate
6.62%
Mortgage Type
New Conventional
Estimated Equity
$87,052
Purchase Details
Closed on
Oct 17, 2017
Sold by
Tangen John S
Bought by
Viessman Brian
Home Financials for this Owner
Home Financials are based on the most recent Mortgage that was taken out on this home.
Original Mortgage
$184,594
Interest Rate
3.91%
Mortgage Type
FHA
Purchase Details
Closed on
Jan 10, 2009
Sold by
Krumm Paul D and Krumm Kristi D
Bought by
Tangen John S
Home Financials for this Owner
Home Financials are based on the most recent Mortgage that was taken out on this home.
Original Mortgage
$102,300
Interest Rate
5.37%
Mortgage Type
Adjustable Rate Mortgage/ARM
Purchase Details
Closed on
Dec 31, 2007
Sold by
Jordahl Custom Homes Inc
Bought by
Krumm Paul D and Krumm Kristi D
Home Financials for this Owner
Home Financials are based on the most recent Mortgage that was taken out on this home.
Original Mortgage
$119,700
Interest Rate
6.27%
Mortgage Type
New Conventional
Create a Home Valuation Report for This Property
The Home Valuation Report is an in-depth analysis detailing your home's value as well as a comparison with similar homes in the area
Home Values in the Area
Average Home Value in this Area
Purchase History
| Date | Buyer | Sale Price | Title Company |
|---|---|---|---|
| Droogsma Mitchell J | $265,000 | The Title Company | |
| Viessman Brian | $188,000 | Title Co | |
| Tangen John S | -- | -- | |
| Krumm Paul D | -- | -- |
Source: Public Records
Mortgage History
| Date | Status | Borrower | Loan Amount |
|---|---|---|---|
| Open | Droogsma Mitchell J | $175,000 | |
| Previous Owner | Viessman Brian | $184,594 | |
| Previous Owner | Tangen John S | $102,300 | |
| Previous Owner | Krumm Paul D | $119,700 |
Source: Public Records
Tax History Compared to Growth
Tax History
| Year | Tax Paid | Tax Assessment Tax Assessment Total Assessment is a certain percentage of the fair market value that is determined by local assessors to be the total taxable value of land and additions on the property. | Land | Improvement |
|---|---|---|---|---|
| 2024 | $3,334 | $116,500 | $18,350 | $98,150 |
| 2023 | $3,176 | $110,000 | $18,350 | $91,650 |
| 2022 | $3,151 | $104,400 | $18,350 | $86,050 |
| 2021 | $2,945 | $93,700 | $15,600 | $78,100 |
| 2020 | $2,779 | $92,250 | $15,600 | $76,650 |
| 2019 | $2,579 | $91,750 | $15,600 | $76,150 |
| 2018 | $2,447 | $91,000 | $15,600 | $75,400 |
| 2017 | $3,208 | $88,250 | $15,600 | $72,650 |
| 2016 | $3,113 | $85,300 | $15,600 | $69,700 |
| 2015 | $3,086 | $76,900 | $7,550 | $69,350 |
| 2014 | $2,946 | $71,850 | $7,550 | $64,300 |
| 2013 | $2,923 | $68,500 | $6,650 | $61,850 |
Source: Public Records
Map
Nearby Homes
- 609 13 1 2 Ave S
- 609 13 1/2 Ave E
- 603 13 1 2 Ave W
- 603 13 1/2 Ave E
- 611 13 1/2 Ave E
- 615 13 1 2 Ave S
- 615 13 1/2 Ave E
- 606 14th Ave E
- 610 14th Ave E
- 604 14th Ave E
- 612 14th Ave E
- 617 13 1 2 Ave S
- 617 13 1/2 Ave E
- 616 14th Ave E
- 621 13 1 2 Ave S
- 621 13 1/2 Ave E
- 618 14th Ave E
- 622 14th Ave E
- 1358 6th St E
- 623 13 1/2 Ave E