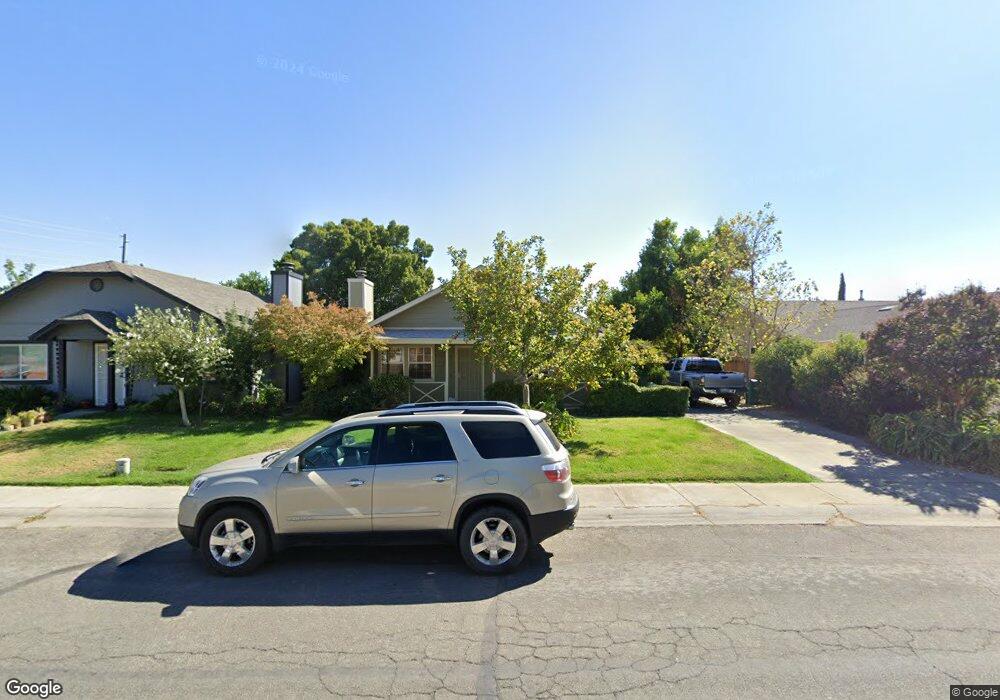
605 Date St Orland, CA 95963
Estimated Value: $330,000 - $408,000
3
Beds
2
Baths
1,344
Sq Ft
$274/Sq Ft
Est. Value
About This Home
This home is located at 605 Date St, Orland, CA 95963 and is currently estimated at $368,480, approximately $274 per square foot. 605 Date St is a home located in Glenn County with nearby schools including Mill Street Elementary School, Fairview Elementary School, and Price Intermediate School.
Ownership History
Date
Name
Owned For
Owner Type
Purchase Details
Closed on
Feb 3, 2022
Sold by
Pontarolo Bert J
Bought by
Duenas Sergio
Current Estimated Value
Purchase Details
Closed on
Feb 1, 2022
Sold by
Pontarolo Bert J
Bought by
Duenas Sergio
Purchase Details
Closed on
May 19, 2006
Sold by
Pontarolo Bert J
Bought by
Pontarolo Darrell G and Pontarolo Robert J
Purchase Details
Closed on
May 4, 2006
Sold by
Pontarolo Bert J and Pontarolo Sybil O
Bought by
Pontarolo Bert J
Purchase Details
Closed on
Jun 23, 2003
Sold by
Eustler Susan D and Neville Susan D
Bought by
Pontarolo Bert J and Pontarolo Sybil O
Create a Home Valuation Report for This Property
The Home Valuation Report is an in-depth analysis detailing your home's value as well as a comparison with similar homes in the area
Home Values in the Area
Average Home Value in this Area
Purchase History
| Date | Buyer | Sale Price | Title Company |
|---|---|---|---|
| Duenas Sergio | $315,000 | Timios | |
| Duenas Sergio | $315,000 | Timios | |
| Pontarolo Darrell G | -- | None Available | |
| Pontarolo Bert J | -- | None Available | |
| Pontarolo Bert J | -- | None Available | |
| Pontarolo Bert J | $168,000 | North State Title Co |
Source: Public Records
Tax History Compared to Growth
Tax History
| Year | Tax Paid | Tax Assessment Tax Assessment Total Assessment is a certain percentage of the fair market value that is determined by local assessors to be the total taxable value of land and additions on the property. | Land | Improvement |
|---|---|---|---|---|
| 2025 | $3,640 | $334,279 | $106,120 | $228,159 |
| 2024 | $3,640 | $327,726 | $104,040 | $223,686 |
| 2023 | $3,568 | $321,300 | $102,000 | $219,300 |
| 2022 | $305 | $30,420 | $7,798 | $22,622 |
| 2021 | $321 | $29,825 | $7,646 | $22,179 |
| 2020 | $321 | $29,520 | $7,568 | $21,952 |
| 2019 | $317 | $28,942 | $7,420 | $21,522 |
| 2018 | $298 | $28,375 | $7,275 | $21,100 |
| 2017 | $305 | $27,820 | $7,133 | $20,687 |
| 2016 | $288 | $27,276 | $6,994 | $20,282 |
| 2015 | -- | $26,867 | $6,889 | $19,978 |
| 2014 | $276 | $26,342 | $6,755 | $19,587 |
Source: Public Records
Map
Nearby Homes