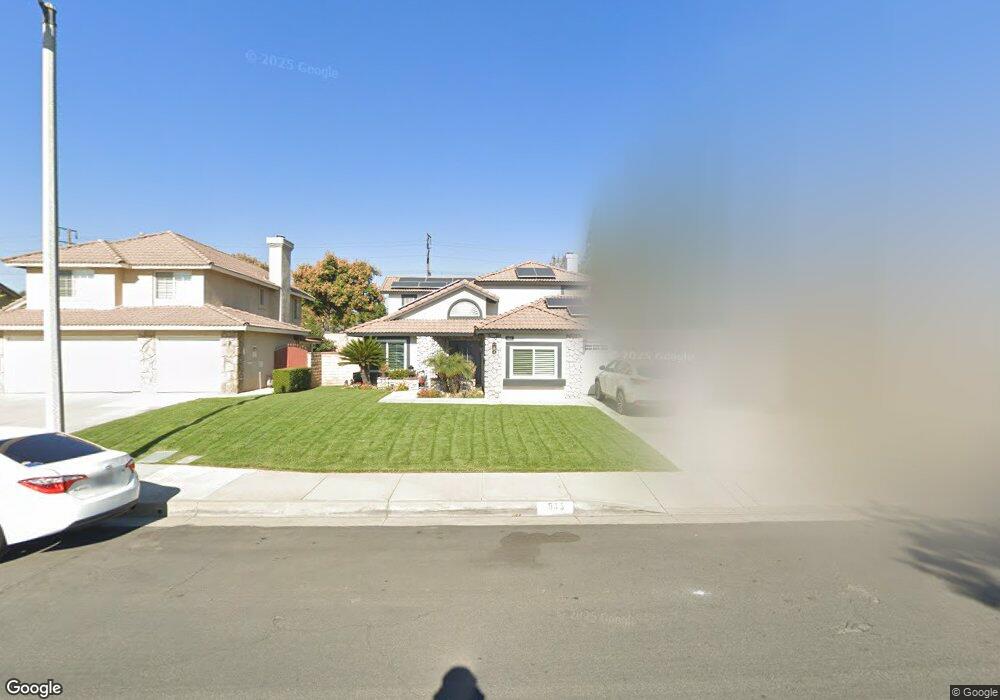
605 E Bermuda Dunes St Ontario, CA 91761
Ontario Ranch NeighborhoodEstimated Value: $778,963 - $905,000
4
Beds
3
Baths
2,106
Sq Ft
$394/Sq Ft
Est. Value
About This Home
This home is located at 605 E Bermuda Dunes St, Ontario, CA 91761 and is currently estimated at $829,741, approximately $393 per square foot. 605 E Bermuda Dunes St is a home located in San Bernardino County with nearby schools including Liberty Elementary School, Woodcrest Junior High, and Chino High School.
Ownership History
Date
Name
Owned For
Owner Type
Purchase Details
Closed on
Sep 14, 2001
Sold by
Flores Cesar E
Bought by
Flores Cesar E and Flores Cheryl L
Current Estimated Value
Home Financials for this Owner
Home Financials are based on the most recent Mortgage that was taken out on this home.
Original Mortgage
$211,500
Outstanding Balance
$81,993
Interest Rate
6.91%
Estimated Equity
$747,748
Purchase Details
Closed on
Jul 8, 1996
Sold by
Flores Cesar E
Bought by
Flores Cesar E and Flores Cheryl L
Purchase Details
Closed on
May 7, 1996
Sold by
Van Daele/Ontario Ltd
Bought by
Flores Cesar E and Flores Cheryl L
Home Financials for this Owner
Home Financials are based on the most recent Mortgage that was taken out on this home.
Original Mortgage
$129,850
Interest Rate
8.01%
Create a Home Valuation Report for This Property
The Home Valuation Report is an in-depth analysis detailing your home's value as well as a comparison with similar homes in the area
Home Values in the Area
Average Home Value in this Area
Purchase History
| Date | Buyer | Sale Price | Title Company |
|---|---|---|---|
| Flores Cesar E | -- | New Century Title Company | |
| Flores Cesar E | -- | First American Title Ins Co | |
| Flores Cesar E | $202,000 | First American Title Ins Co |
Source: Public Records
Mortgage History
| Date | Status | Borrower | Loan Amount |
|---|---|---|---|
| Open | Flores Cesar E | $211,500 | |
| Previous Owner | Flores Cesar E | $129,850 |
Source: Public Records
Tax History
| Year | Tax Paid | Tax Assessment Tax Assessment Total Assessment is a certain percentage of the fair market value that is determined by local assessors to be the total taxable value of land and additions on the property. | Land | Improvement |
|---|---|---|---|---|
| 2025 | $3,742 | $341,670 | $82,250 | $259,420 |
| 2024 | $3,641 | $334,970 | $80,637 | $254,333 |
| 2023 | $3,539 | $328,402 | $79,056 | $249,346 |
| 2022 | $3,517 | $321,963 | $77,506 | $244,457 |
| 2021 | $3,447 | $315,650 | $75,986 | $239,664 |
| 2020 | $4,002 | $312,414 | $75,207 | $237,207 |
| 2019 | $3,941 | $306,288 | $73,732 | $232,556 |
| 2018 | $3,866 | $300,282 | $72,286 | $227,996 |
| 2017 | $3,806 | $294,394 | $70,869 | $223,525 |
| 2016 | $3,595 | $288,621 | $69,479 | $219,142 |
| 2015 | $3,534 | $284,285 | $68,435 | $215,850 |
| 2014 | $3,475 | $278,716 | $67,094 | $211,622 |
Source: Public Records
Map
Nearby Homes
- 513 E Fairfield Ct
- 619 E Joseph Privado
- 2408 S Taylor Place
- 2300 S Sultana Ave Unit 298
- 2300 S Sultana Ave Unit 286
- 2300 S Sultana Ave Unit 256
- 2300 S Sultana Ave Unit 206
- 683 E Joseph Privado
- 125 E Saint Andrews St
- 665 E Riverside Dr Unit 3
- 2819 S Euclid Ave
- 310 E Philadelphia St Unit 147
- 310 E Philadelphia St
- 310 E Philadelphia St Unit SPC 102
- 4315 S Grasly Paseo
- 0 Vineyard Unit CV25067044
- 1528 1538 W Holt
- 1305 W North Pinecrest
- 2644 S Cucamonga Ave
- 2119 S Phoenix Place
- 573 E Bermuda Dunes St
- 613 E Bermuda Dunes St
- 565 E Bermuda Dunes St
- 621 E Bermuda Dunes St
- 606 E Bermuda Dunes St
- 2560 S Miramonte Ave
- 580 E Bermuda Dunes St
- 557 E Bermuda Dunes St
- 614 E Bermuda Dunes St
- 629 E Bermuda Dunes St
- 572 E Bermuda Dunes St
- 622 E Bermuda Dunes St
- 2556 S Miramonte Ave
- 2557 S Monterey Ave
- 564 E Bermuda Dunes St
- 2550 S Miramonte Ave
- 609 E Tam o Shanter St
- 583 E Tam o Shanter St
- 556 E Bermuda Dunes St
Your Personal Tour Guide
Ask me questions while you tour the home.