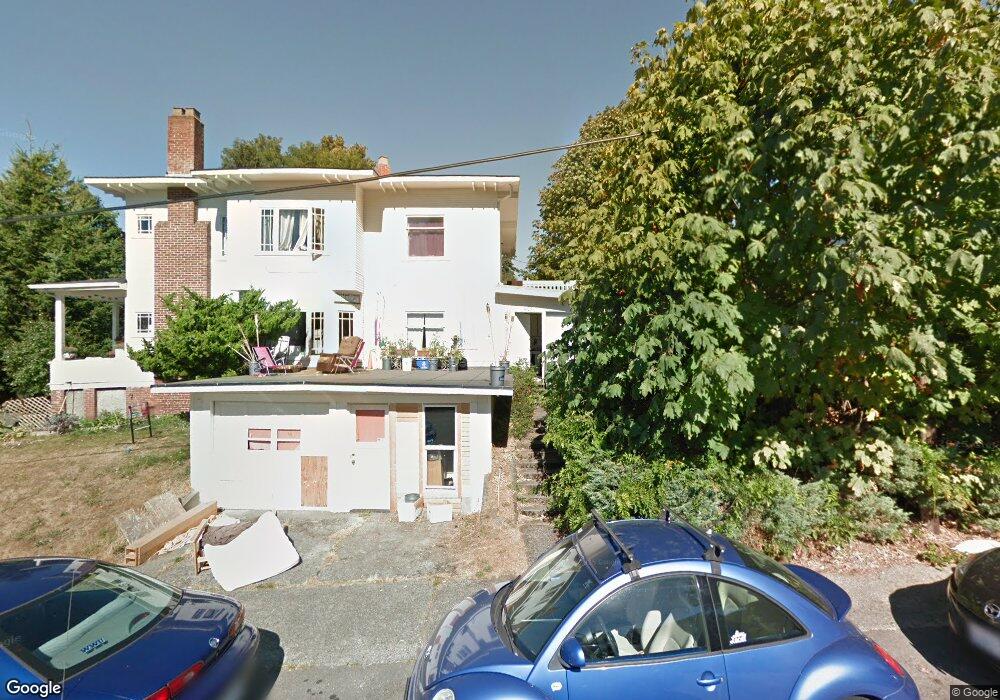
605 E Myrtle St Bellingham, WA 98225
Sehome NeighborhoodEstimated Value: $570,000 - $1,282,406
6
Beds
5
Baths
4,146
Sq Ft
$248/Sq Ft
Est. Value
About This Home
This home is located at 605 E Myrtle St, Bellingham, WA 98225 and is currently estimated at $1,028,352, approximately $248 per square foot. 605 E Myrtle St is a home located in Whatcom County with nearby schools including Lowell Elementary School, Fairhaven Middle School, and Sehome High School.
Ownership History
Date
Name
Owned For
Owner Type
Purchase Details
Closed on
Aug 26, 2014
Sold by
Mp Rentals Llc
Bought by
Hansen David N and Hansen Carmen K
Current Estimated Value
Purchase Details
Closed on
Apr 10, 2008
Sold by
Kaufhold Deborah M Denson
Bought by
Mp Rentals Llc
Home Financials for this Owner
Home Financials are based on the most recent Mortgage that was taken out on this home.
Original Mortgage
$160,000
Interest Rate
6.22%
Mortgage Type
Purchase Money Mortgage
Purchase Details
Closed on
Oct 21, 2002
Sold by
Kaufhold Deborah M Denson
Bought by
Kaufhold Deborah M Denson
Purchase Details
Closed on
Apr 12, 2002
Sold by
Kaufhold Deborah M
Bought by
Moceri Paul J and Porter Susan M
Purchase Details
Closed on
Jun 21, 1999
Sold by
Denson Ira E and Denson Loleta M
Bought by
Denson Ira E
Create a Home Valuation Report for This Property
The Home Valuation Report is an in-depth analysis detailing your home's value as well as a comparison with similar homes in the area
Home Values in the Area
Average Home Value in this Area
Purchase History
| Date | Buyer | Sale Price | Title Company |
|---|---|---|---|
| Hansen David N | $525,000 | Whatcom Land Title | |
| Mp Rentals Llc | -- | Whatcom Land Title | |
| Kaufhold Deborah M Denson | -- | -- | |
| Moceri Paul J | -- | -- | |
| Denson Ira E | -- | -- |
Source: Public Records
Mortgage History
| Date | Status | Borrower | Loan Amount |
|---|---|---|---|
| Previous Owner | Mp Rentals Llc | $160,000 |
Source: Public Records
Tax History Compared to Growth
Tax History
| Year | Tax Paid | Tax Assessment Tax Assessment Total Assessment is a certain percentage of the fair market value that is determined by local assessors to be the total taxable value of land and additions on the property. | Land | Improvement |
|---|---|---|---|---|
| 2024 | $8,810 | $1,104,382 | $405,629 | $698,753 |
| 2023 | $8,810 | $1,132,500 | $415,956 | $716,544 |
| 2022 | $6,965 | $959,764 | $352,512 | $607,252 |
| 2021 | $6,833 | $749,816 | $275,400 | $474,416 |
| 2020 | $7,289 | $694,274 | $255,000 | $439,274 |
| 2019 | $6,865 | $715,833 | $218,300 | $497,533 |
| 2018 | $6,920 | $676,018 | $206,294 | $469,724 |
| 2017 | $6,026 | $582,570 | $177,295 | $405,275 |
| 2016 | $5,369 | $530,249 | $161,218 | $369,031 |
| 2015 | $5,382 | $491,780 | $152,073 | $339,707 |
| 2014 | -- | $476,992 | $147,500 | $329,492 |
| 2013 | -- | $445,082 | $141,600 | $303,482 |
Source: Public Records
Map
Nearby Homes
- 616 E Myrtle St
- 615 E Myrtle St
- 901 N Forest St Unit 107
- 901 N Forest St Unit 125
- 901 N Forest St Unit 109
- 310 E Ivy St
- 1001 N State St Unit 403
- 1031 N State St Unit 107
- 1031 N State St Unit 209
- 1126 N Forest St
- 1015 Railroad Ave Unit 418
- 1309 Billy Frank Jr St
- 1205 E Maple St
- 0 Pine St Unit NWM2445229
- 1125 Otis St
- 414 Boulevard Unit 105
- 415 N State St
- 402 Boulevard Unit 103
- 1234 Grant St
- 1342 Franklin St
- 900 High St
- 904 High St
- 906 High St
- 615 E Myrtle St
- 608 E Myrtle St
- 830 High St Unit 302
- 830 High St Unit 301
- 830 High St Unit 202
- 830 High St Unit 201
- 830 High St Unit 102
- 830 High St Unit 101
- 830 High St
- 612 E Myrtle St
- 901 High St
- 515 E Myrtle St
- 619 E Myrtle St
- 824 High St
- 911 Billy Frank Jr St
- 911 Billy Frank Jr St
- 911 Billy Frank Jr St