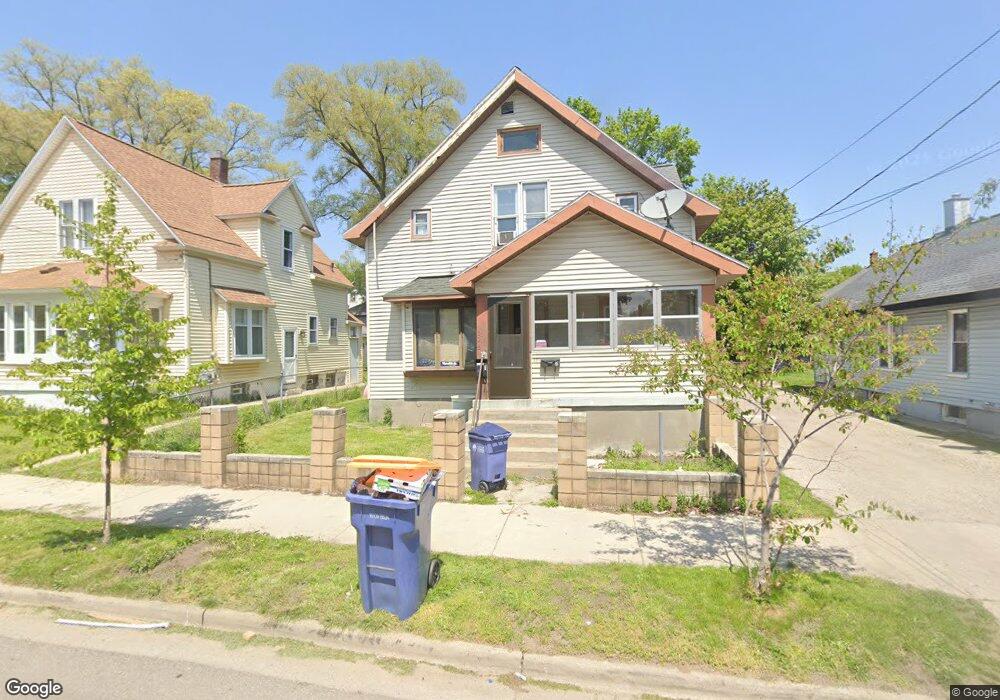
605 High St SW Grand Rapids, MI 49503
Roosevelt Park NeighborhoodEstimated Value: $168,000 - $221,000
4
Beds
2
Baths
1,512
Sq Ft
$130/Sq Ft
Est. Value
About This Home
This home is located at 605 High St SW, Grand Rapids, MI 49503 and is currently estimated at $196,457, approximately $129 per square foot. 605 High St SW is a home located in Kent County with nearby schools including Cesar E. Chavez Elementary, Burton Middle School, and Union High School.
Ownership History
Date
Name
Owned For
Owner Type
Purchase Details
Closed on
Jul 11, 2011
Sold by
Escobar Douglas and Escobar Gloria
Bought by
West Michigan Apartments Llc
Current Estimated Value
Purchase Details
Closed on
Aug 11, 2008
Sold by
Escobar Douglas and Escobar Gloria
Bought by
Escobar Douglas and Escobar Gloria
Home Financials for this Owner
Home Financials are based on the most recent Mortgage that was taken out on this home.
Original Mortgage
$43,000
Interest Rate
6.39%
Mortgage Type
Commercial
Purchase Details
Closed on
Nov 2, 2007
Sold by
Sanchez Javier and Sanchez Josefa
Bought by
Escobar Douglas
Purchase Details
Closed on
Jul 18, 2007
Sold by
Sanchez Javier and Sanchez Josefa
Bought by
Household Finance Corp Iii
Purchase Details
Closed on
Jan 6, 1994
Sold by
Entrp Entrp B B and Entrp B
Bought by
West Michigan Apartments Llc
Purchase Details
Closed on
Sep 11, 1991
Purchase Details
Closed on
Jan 11, 1989
Purchase Details
Closed on
Apr 27, 1988
Create a Home Valuation Report for This Property
The Home Valuation Report is an in-depth analysis detailing your home's value as well as a comparison with similar homes in the area
Home Values in the Area
Average Home Value in this Area
Purchase History
| Date | Buyer | Sale Price | Title Company |
|---|---|---|---|
| West Michigan Apartments Llc | -- | None Available | |
| Escobar Douglas | -- | Metropolitan Title Company | |
| Escobar Douglas | $35,000 | Metropolitan Title Company | |
| Household Finance Corp Iii | $64,064 | None Available | |
| West Michigan Apartments Llc | $27,900 | -- | |
| -- | -- | -- | |
| -- | $11,900 | -- | |
| -- | $100 | -- |
Source: Public Records
Mortgage History
| Date | Status | Borrower | Loan Amount |
|---|---|---|---|
| Previous Owner | Escobar Douglas | $43,000 |
Source: Public Records
Tax History Compared to Growth
Tax History
| Year | Tax Paid | Tax Assessment Tax Assessment Total Assessment is a certain percentage of the fair market value that is determined by local assessors to be the total taxable value of land and additions on the property. | Land | Improvement |
|---|---|---|---|---|
| 2025 | $1,343 | $79,400 | $0 | $0 |
| 2024 | $1,343 | $68,800 | $0 | $0 |
| 2023 | $1,332 | $57,700 | $0 | $0 |
| 2022 | $1,266 | $45,700 | $0 | $0 |
| 2021 | $1,233 | $40,800 | $0 | $0 |
| 2020 | $1,192 | $36,100 | $0 | $0 |
| 2019 | $1,183 | $33,000 | $0 | $0 |
| 2018 | $1,183 | $25,600 | $0 | $0 |
| 2017 | $1,154 | $21,900 | $0 | $0 |
| 2016 | $1,160 | $22,900 | $0 | $0 |
| 2015 | $1,156 | $22,900 | $0 | $0 |
| 2013 | -- | $21,900 | $0 | $0 |
Source: Public Records
Map
Nearby Homes
- 601 High St SW
- 513 Crofton St SW
- 719 Coate Ct SW
- 721 Olympia St SW
- 730 Liberty St SW
- 757 Tulip St SW
- 358 Fox St SW
- 343 Corinne St SW
- 325 Brown St SW
- 962 Sheridan Ave SW
- 543 Tenhaaf Ct SW
- 1805 Stafford Ave SW
- 362 Fox St SW
- 1828 Stafford Ave SW
- 1265 Ionia Ave SW
- 125 Hall St SW
- 1917 Osmer Ave SW
- 1112 Albers St SW
- 841 Oakland Ave SW
- 1715 Godfrey Ave SW
- 609 High St SW
- 547 High St SW
- 602 Naylor St SW
- 606 Naylor St SW
- 556 Naylor St SW
- 619 High St SW
- 543 High St SW
- 552 Naylor St SW
- 610 Naylor St SW
- 604 High St SW
- 608 High St SW
- 548 Naylor St SW
- 614 Naylor St SW
- 546 High St SW
- 623 High St SW
- 539 High St SW
- 612 High St SW
- 618 High St SW
- 544 Naylor St SW
- 618 Naylor St SW