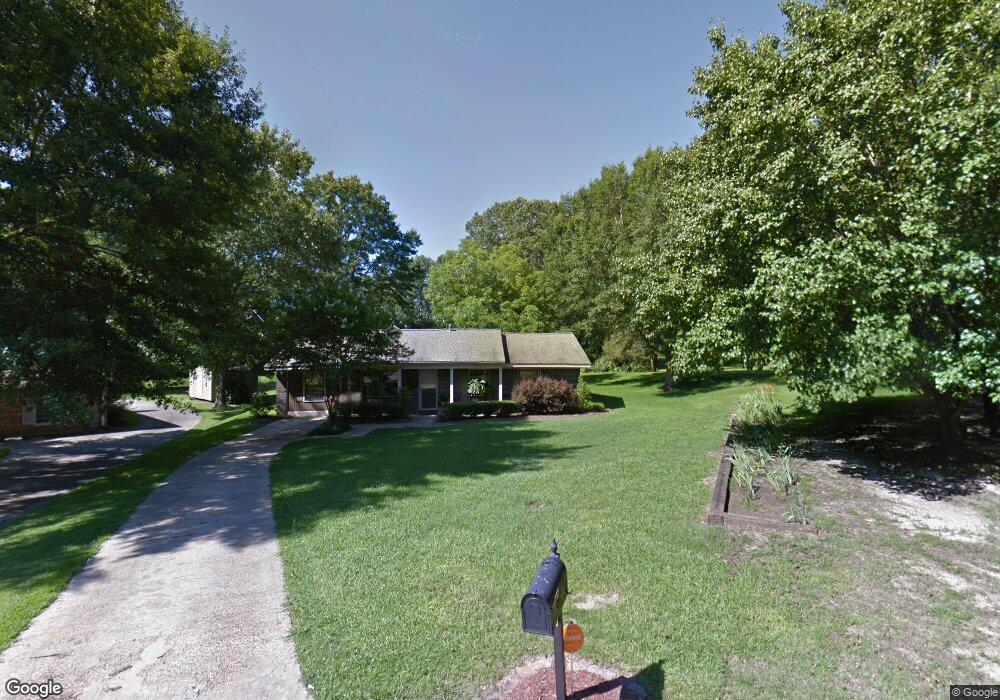
605 Jones Cir West Point, MS 39773
Estimated Value: $141,000 - $184,000
3
Beds
--
Bath
1,574
Sq Ft
$104/Sq Ft
Est. Value
About This Home
This home is located at 605 Jones Cir, West Point, MS 39773 and is currently estimated at $163,811, approximately $104 per square foot. 605 Jones Cir is a home located in Clay County with nearby schools including East Side Elementary School, West Clay Elementary School, and Church Hill Elementary School.
Ownership History
Date
Name
Owned For
Owner Type
Purchase Details
Closed on
Apr 4, 2024
Sold by
Cummings Marley G and Glusenkamp Lee A
Bought by
Coggins Collin
Current Estimated Value
Home Financials for this Owner
Home Financials are based on the most recent Mortgage that was taken out on this home.
Original Mortgage
$7,000
Interest Rate
6.9%
Mortgage Type
New Conventional
Purchase Details
Closed on
Mar 23, 2018
Sold by
Mcvay Andrew Tyler and Mcvay Mallory Ncbrayer
Bought by
Cummings Marley G and Glusenkamp Lee A
Home Financials for this Owner
Home Financials are based on the most recent Mortgage that was taken out on this home.
Original Mortgage
$102,606
Interest Rate
4.62%
Mortgage Type
FHA
Create a Home Valuation Report for This Property
The Home Valuation Report is an in-depth analysis detailing your home's value as well as a comparison with similar homes in the area
Home Values in the Area
Average Home Value in this Area
Purchase History
| Date | Buyer | Sale Price | Title Company |
|---|---|---|---|
| Coggins Collin | -- | None Listed On Document | |
| Cummings Marley G | -- | -- |
Source: Public Records
Mortgage History
| Date | Status | Borrower | Loan Amount |
|---|---|---|---|
| Closed | Coggins Collin | $7,000 | |
| Open | Coggins Collin | $118,686 | |
| Previous Owner | Cummings Marley G | $102,606 |
Source: Public Records
Tax History Compared to Growth
Tax History
| Year | Tax Paid | Tax Assessment Tax Assessment Total Assessment is a certain percentage of the fair market value that is determined by local assessors to be the total taxable value of land and additions on the property. | Land | Improvement |
|---|---|---|---|---|
| 2024 | $398 | $9,047 | $1,200 | $7,847 |
| 2023 | $988 | $7,644 | $1,200 | $6,444 |
| 2022 | $343 | $7,644 | $1,200 | $6,444 |
| 2021 | $339 | $7,644 | $1,200 | $6,444 |
| 2020 | $343 | $7,644 | $1,200 | $6,444 |
| 2019 | $316 | $7,586 | $1,200 | $6,386 |
| 2018 | $228 | $7,586 | $1,200 | $6,386 |
| 2017 | $228 | $7,586 | $1,200 | $6,386 |
| 2016 | $212 | $7,586 | $1,200 | $6,386 |
| 2015 | $198 | $6,910 | $1,200 | $5,710 |
| 2014 | $172 | $6,910 | $1,200 | $5,710 |
| 2013 | $172 | $6,910 | $1,200 | $5,710 |
Source: Public Records
Map
Nearby Homes
- 1124 N Eshman Ave
- 27445 E Main St
- 564 E Morrow St
- 530 E Morrow St
- 27045 E Main St
- 26596 E Main St
- 318 Progress St
- 1153 E Broad St
- 26852 E Main St
- 1180 E Broad St
- 1104 E Broad St
- 26788 E Main St
- 551 E Westbrook St
- 63 Clay St
- 485 E Westbrook St
- 480 E Westbrook St
- 479 E Westbrook St
- 164 Belvedere Ave
- 278 Converse Dr
- 218 Lewellen St