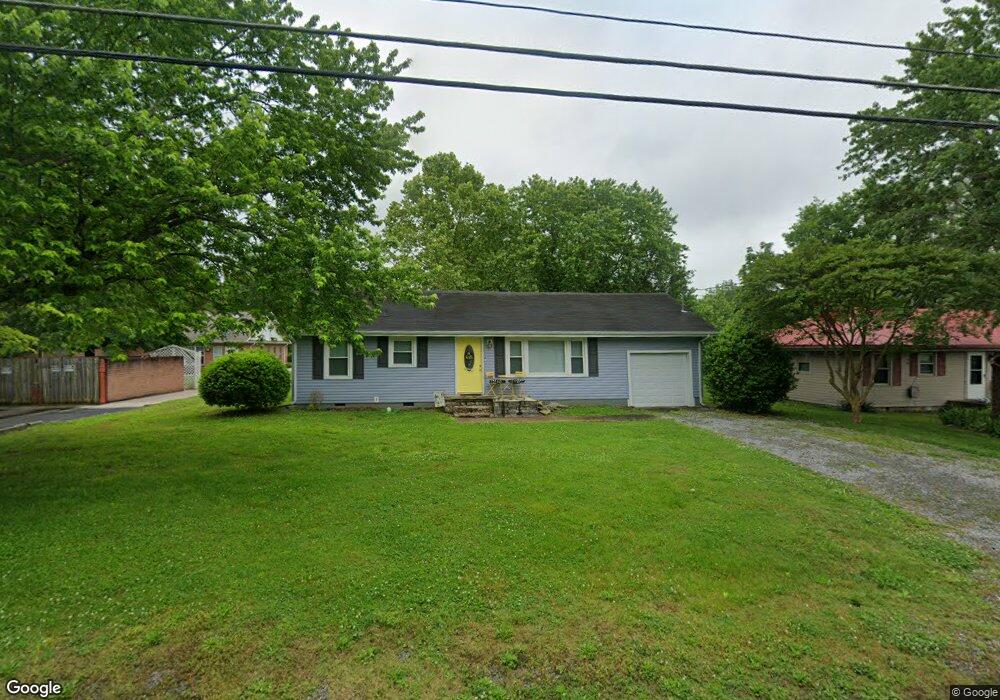
605 Mac St Shelbyville, TN 37160
Estimated Value: $121,715 - $281,000
--
Bed
1
Bath
912
Sq Ft
$228/Sq Ft
Est. Value
About This Home
This home is located at 605 Mac St, Shelbyville, TN 37160 and is currently estimated at $207,679, approximately $227 per square foot. 605 Mac St is a home located in Bedford County with nearby schools including East Side Elementary School, Harris Middle School, and Christian Chapel Academy.
Ownership History
Date
Name
Owned For
Owner Type
Purchase Details
Closed on
Mar 17, 2014
Sold by
Stacy Troy R
Bought by
Stacy Meghan M
Current Estimated Value
Home Financials for this Owner
Home Financials are based on the most recent Mortgage that was taken out on this home.
Original Mortgage
$48,000
Outstanding Balance
$36,220
Interest Rate
4.3%
Mortgage Type
New Conventional
Estimated Equity
$171,459
Purchase Details
Closed on
Feb 28, 2011
Sold by
Thomas Mattie A
Bought by
Stacy Troy R
Purchase Details
Closed on
Jun 5, 1991
Bought by
Thomas Mattie A
Create a Home Valuation Report for This Property
The Home Valuation Report is an in-depth analysis detailing your home's value as well as a comparison with similar homes in the area
Home Values in the Area
Average Home Value in this Area
Purchase History
| Date | Buyer | Sale Price | Title Company |
|---|---|---|---|
| Stacy Meghan M | $45,000 | -- | |
| Stacy Troy R | $42,400 | -- | |
| Thomas Mattie A | $17,500 | -- |
Source: Public Records
Mortgage History
| Date | Status | Borrower | Loan Amount |
|---|---|---|---|
| Open | Stacy Meghan M | $48,000 |
Source: Public Records
Tax History Compared to Growth
Tax History
| Year | Tax Paid | Tax Assessment Tax Assessment Total Assessment is a certain percentage of the fair market value that is determined by local assessors to be the total taxable value of land and additions on the property. | Land | Improvement |
|---|---|---|---|---|
| 2025 | -- | $17,075 | $0 | $0 |
| 2024 | -- | $17,075 | $3,775 | $13,300 |
| 2023 | $650 | $17,075 | $3,775 | $13,300 |
| 2022 | $668 | $17,075 | $3,775 | $13,300 |
| 2021 | $607 | $17,075 | $3,775 | $13,300 |
| 2020 | $488 | $17,075 | $3,775 | $13,300 |
| 2019 | $488 | $11,000 | $2,250 | $8,750 |
| 2018 | $477 | $11,000 | $2,250 | $8,750 |
| 2017 | $477 | $11,000 | $2,250 | $8,750 |
| 2016 | $472 | $11,000 | $2,250 | $8,750 |
| 2015 | $472 | $11,000 | $2,250 | $8,750 |
| 2014 | $392 | $10,009 | $0 | $0 |
Source: Public Records
Map
Nearby Homes
- 402 Rose Ln
- 130 Horseshoe Dr
- 152 Demonbreum Cir
- 329 Dover St
- 106 Demonbreum Cir
- 110 Demonbreum Cir
- 107 Demonbreum Cir
- 111 Demonbreum Cir
- 410 Dover St
- 1030 Union St
- 122 Laurelwood Dr
- 112 Demombreum Cir
- 100 Demombreum Cir
- 109 Demombreum Cir
- 407 Dow Dr
- 108 Demombreum Cir
- 101 Briar Patch Dr
- 1615 Elevation ABC Plan at Wheatfield
- 1567 Elevation ABC Plan at Wheatfield
- 119 Millet St