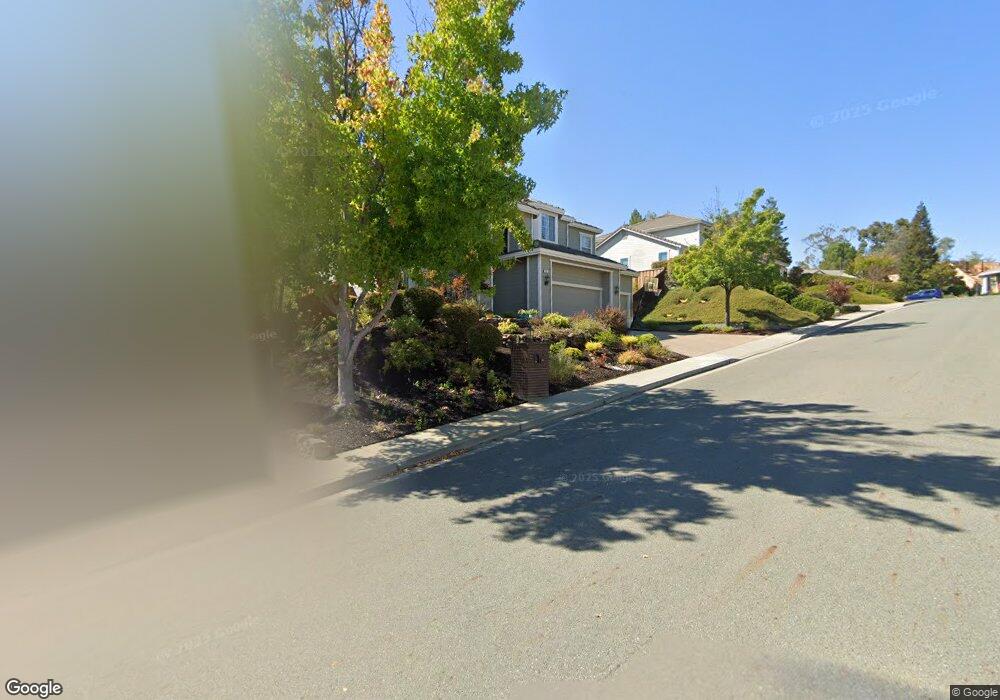
605 Old Vine Ct Pleasant Hill, CA 94523
Estimated Value: $1,522,000 - $1,795,000
5
Beds
3
Baths
2,618
Sq Ft
$622/Sq Ft
Est. Value
About This Home
This home is located at 605 Old Vine Ct, Pleasant Hill, CA 94523 and is currently estimated at $1,629,257, approximately $622 per square foot. 605 Old Vine Ct is a home located in Contra Costa County with nearby schools including Valhalla Elementary School, Valley View Middle School, and College Park High School.
Ownership History
Date
Name
Owned For
Owner Type
Purchase Details
Closed on
Jun 28, 2019
Sold by
Nilsen Daniel B and Nilsen Andrea T
Bought by
Nilsen Daniel B and Nilsen Andrea T
Current Estimated Value
Home Financials for this Owner
Home Financials are based on the most recent Mortgage that was taken out on this home.
Original Mortgage
$952,000
Outstanding Balance
$837,098
Interest Rate
4%
Mortgage Type
New Conventional
Estimated Equity
$792,159
Purchase Details
Closed on
Sep 11, 2017
Sold by
Daiker Steven D
Bought by
Nilsen Dan B and Nilsen Andrea T
Home Financials for this Owner
Home Financials are based on the most recent Mortgage that was taken out on this home.
Original Mortgage
$636,000
Interest Rate
3.89%
Mortgage Type
New Conventional
Purchase Details
Closed on
May 14, 2012
Sold by
Daiker Steven D
Bought by
Daiker Steven D
Purchase Details
Closed on
Feb 18, 1997
Sold by
Daiker Patricia
Bought by
Daiker Steven D
Create a Home Valuation Report for This Property
The Home Valuation Report is an in-depth analysis detailing your home's value as well as a comparison with similar homes in the area
Home Values in the Area
Average Home Value in this Area
Purchase History
| Date | Buyer | Sale Price | Title Company |
|---|---|---|---|
| Nilsen Daniel B | -- | Chicago Title Company | |
| Nilsen Dan B | $1,075,000 | Chicago Title Company | |
| Daiker Steven D | -- | None Available | |
| Daiker Steven D | -- | Old Republic Title Company | |
| Daiker Steven D | $410,500 | Old Republic Title Company |
Source: Public Records
Mortgage History
| Date | Status | Borrower | Loan Amount |
|---|---|---|---|
| Open | Nilsen Daniel B | $952,000 | |
| Closed | Nilsen Dan B | $636,000 |
Source: Public Records
Tax History Compared to Growth
Tax History
| Year | Tax Paid | Tax Assessment Tax Assessment Total Assessment is a certain percentage of the fair market value that is determined by local assessors to be the total taxable value of land and additions on the property. | Land | Improvement |
|---|---|---|---|---|
| 2025 | $14,171 | $1,223,162 | $682,696 | $540,466 |
| 2024 | $13,948 | $1,199,179 | $669,310 | $529,869 |
| 2023 | $13,948 | $1,175,667 | $656,187 | $519,480 |
| 2022 | $13,830 | $1,152,616 | $643,321 | $509,295 |
| 2021 | $13,542 | $1,130,016 | $630,707 | $499,309 |
| 2019 | $13,296 | $1,096,500 | $612,000 | $484,500 |
| 2018 | $12,834 | $1,075,000 | $600,000 | $475,000 |
| 2017 | $7,483 | $610,584 | $196,461 | $414,123 |
| 2016 | $7,309 | $598,612 | $192,609 | $406,003 |
| 2015 | $7,256 | $589,621 | $189,716 | $399,905 |
| 2014 | $7,167 | $578,072 | $186,000 | $392,072 |
Source: Public Records
Map
Nearby Homes
- 368 Grapevine Place
- 576 Best Rd
- 900 Kimberly Cir
- 505 Tananger Heights Ct
- 2951 Hannan Dr
- 5 Harwich Walk Unit 55
- 58 Ramsgate Ln
- 589 Maureen Ln
- 220 Devonshire Ct
- 1919 Helen Rd Unit 2
- 309 Sunset Rd
- 2422 Pleasant Hill Rd Unit 6
- 117 Haven Cir
- 616 Aleta Place
- 2162 Orin Ln
- 277 Gloria Dr
- 2017 Morello Ave
- 808 Grayson Rd
- 8 Skander Ct
- 1772 Ruth Dr
- 607 Old Vine Ct
- 603 Old Vine Ct
- 18 Lindsey Ct
- 19 Lindsey Ct
- 609 Old Vine Ct
- 602 Old Vine Ct
- 604 Old Vine Ct
- 10 Mercury Ct
- 20 Mercury Ct
- 600 Old Vine Ct
- 14 Lindsey Ct
- 15 Lindsey Ct
- 19 William Henry Ct
- 18 Barton Ct
- 611 Old Vine Ct
- 608 Old Vine Ct
- 15 William Henry Ct
- 299 Mercury Way
- 14 Barton Ct
- 610 Old Vine Ct