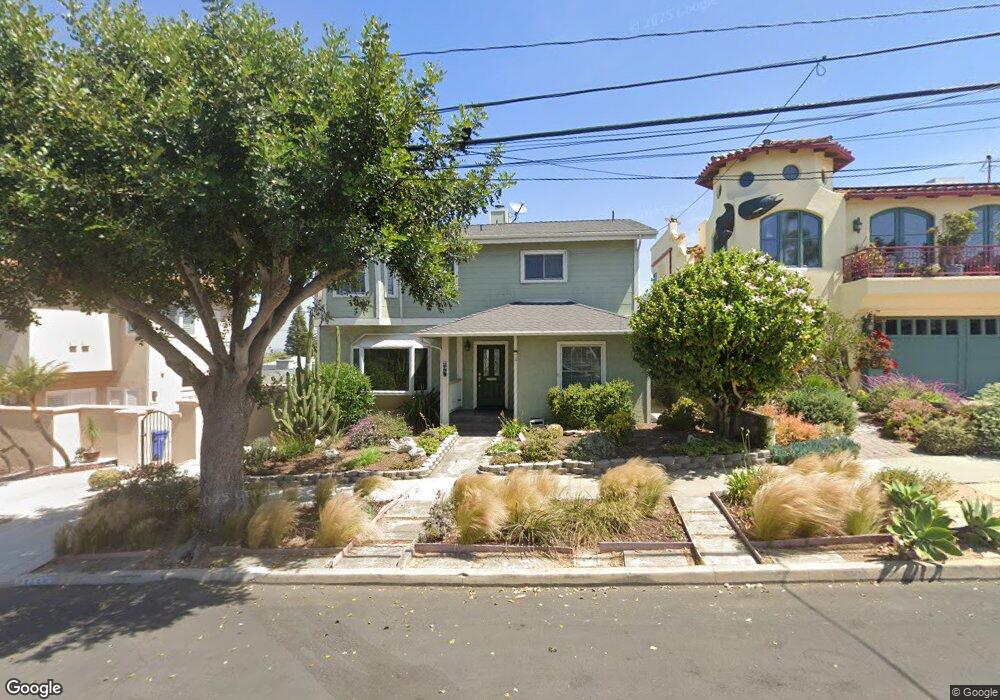
605 Ruby St Redondo Beach, CA 90277
Estimated Value: $2,048,899 - $2,545,000
4
Beds
3
Baths
2,352
Sq Ft
$984/Sq Ft
Est. Value
About This Home
This home is located at 605 Ruby St, Redondo Beach, CA 90277 and is currently estimated at $2,313,225, approximately $983 per square foot. 605 Ruby St is a home located in Los Angeles County with nearby schools including Alta Vista Elementary School, Parras (Nick G.) Middle School, and Redondo Union High School.
Ownership History
Date
Name
Owned For
Owner Type
Purchase Details
Closed on
Oct 15, 2003
Sold by
Farrell Gregory C and Farrell Nancy L
Bought by
Farrell Gregory C and Farrell Nancy L
Current Estimated Value
Purchase Details
Closed on
Sep 29, 2000
Sold by
Farrell Gregory C and Farrell Nancy L
Bought by
Farrell Gregory C and Farrell Nancy L
Home Financials for this Owner
Home Financials are based on the most recent Mortgage that was taken out on this home.
Original Mortgage
$392,000
Outstanding Balance
$143,775
Interest Rate
8%
Estimated Equity
$2,169,450
Purchase Details
Closed on
Sep 13, 2000
Sold by
Farrell Gregory C
Bought by
Farrell Gregory Clark and Farrell Nancy Lynn
Home Financials for this Owner
Home Financials are based on the most recent Mortgage that was taken out on this home.
Original Mortgage
$392,000
Outstanding Balance
$143,775
Interest Rate
8%
Estimated Equity
$2,169,450
Purchase Details
Closed on
May 17, 1999
Sold by
Farrell Joseph Trs
Bought by
Farrell Joseph J and Farrell Irrevocable Dolores K
Create a Home Valuation Report for This Property
The Home Valuation Report is an in-depth analysis detailing your home's value as well as a comparison with similar homes in the area
Home Values in the Area
Average Home Value in this Area
Purchase History
| Date | Buyer | Sale Price | Title Company |
|---|---|---|---|
| Farrell Gregory C | -- | -- | |
| Farrell Gregory C | -- | Investors Title Company | |
| Farrell Gregory Clark | -- | Investors Title Company | |
| Farrell Gregory C | -- | Investors Title Company | |
| Farrell Joseph J | -- | -- |
Source: Public Records
Mortgage History
| Date | Status | Borrower | Loan Amount |
|---|---|---|---|
| Open | Farrell Gregory C | $392,000 |
Source: Public Records
Tax History
| Year | Tax Paid | Tax Assessment Tax Assessment Total Assessment is a certain percentage of the fair market value that is determined by local assessors to be the total taxable value of land and additions on the property. | Land | Improvement |
|---|---|---|---|---|
| 2025 | $12,521 | $1,081,360 | $734,160 | $347,200 |
| 2024 | $12,521 | $1,060,158 | $719,765 | $340,393 |
| 2023 | $12,295 | $1,039,371 | $705,652 | $333,719 |
| 2022 | $12,090 | $1,018,992 | $691,816 | $327,176 |
| 2021 | $11,831 | $999,012 | $678,251 | $320,761 |
| 2019 | $11,561 | $969,383 | $658,135 | $311,248 |
| 2018 | $11,241 | $950,377 | $645,231 | $305,146 |
| 2016 | $10,878 | $913,475 | $620,177 | $293,298 |
| 2015 | $10,682 | $899,755 | $610,862 | $288,893 |
| 2014 | $10,530 | $882,131 | $598,897 | $283,234 |
Source: Public Records
Map
Nearby Homes
- 406 S Gertruda Ave
- 508 Judy Dr
- 426 Camino Real
- 418 Miramar Dr
- 625 Camino Real
- 537 S Helberta Ave
- 318 S Francisca Ave
- 517 Sapphire St
- 214 Pearl St
- 227 S Helberta Ave Unit B
- 222 S Guadalupe Ave Unit 1
- 802 Camino Real Unit 105
- 802 Camino Real Unit 206
- 221 S Guadalupe Ave
- 601 S Prospect Ave Unit 103
- 317 S Broadway Unit C
- 603 S Prospect Ave Unit 205
- 308 S Lucia Ave
- 222 S Juanita Ave Unit A
- 420 Esplanade Unit 4
- 607 Ruby St
- 416 S Gertruda Ave
- 601 Ruby St
- 418 S Gertruda Ave
- 609 Ruby St
- 414 S Gertruda Ave
- 611 Ruby St
- 412 S Gertruda Ave
- 604 Ruby St
- 519 Camino Real
- 517 Camino Real
- 610 Ruby St
- 614 Ruby St
- 515 Camino Real
- 618 Ruby St
- 502 S Gertruda Ave
- 521 Camino Real
- 513 Camino Real
- 701 Ruby St
- 504 S Gertruda Ave
Your Personal Tour Guide
Ask me questions while you tour the home.