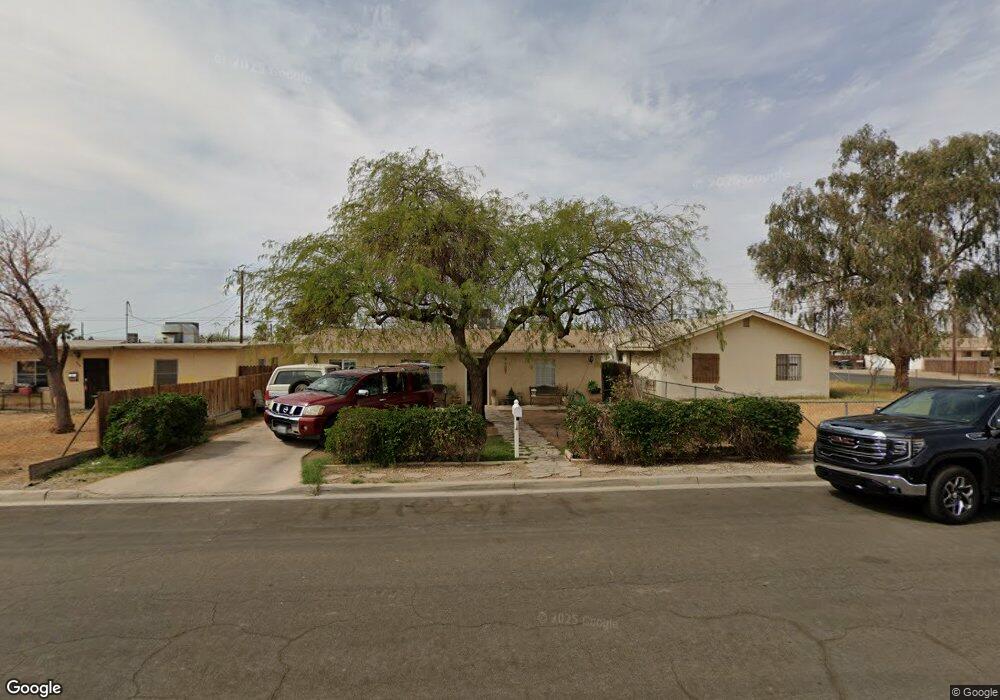
605 S E St Imperial, CA 92251
Estimated Value: $282,000 - $336,000
2
Beds
2
Baths
1,268
Sq Ft
$242/Sq Ft
Est. Value
About This Home
This home is located at 605 S E St, Imperial, CA 92251 and is currently estimated at $307,158, approximately $242 per square foot. 605 S E St is a home located in Imperial County with nearby schools including Ben Hulse Elementary School, Frank M. Wright Middle School, and Imperial High School.
Ownership History
Date
Name
Owned For
Owner Type
Purchase Details
Closed on
Oct 29, 2002
Sold by
Diaz Juan F
Bought by
Diaz Juan F and Diaz Maria
Current Estimated Value
Home Financials for this Owner
Home Financials are based on the most recent Mortgage that was taken out on this home.
Original Mortgage
$82,800
Outstanding Balance
$40,899
Interest Rate
8.5%
Mortgage Type
Purchase Money Mortgage
Estimated Equity
$266,259
Purchase Details
Closed on
Jul 21, 1999
Sold by
Diaz Maria G
Bought by
Diaz Juan F
Purchase Details
Closed on
May 5, 1999
Sold by
Gomez Marco A
Bought by
Diaz Juan F
Home Financials for this Owner
Home Financials are based on the most recent Mortgage that was taken out on this home.
Original Mortgage
$64,468
Interest Rate
7.64%
Mortgage Type
FHA
Create a Home Valuation Report for This Property
The Home Valuation Report is an in-depth analysis detailing your home's value as well as a comparison with similar homes in the area
Purchase History
| Date | Buyer | Sale Price | Title Company |
|---|---|---|---|
| Diaz Juan F | -- | Commonwealth Land Title Co | |
| Diaz Juan F | -- | Chicago Title Co | |
| Diaz Juan F | $65,000 | Chicago Title Co |
Source: Public Records
Mortgage History
| Date | Status | Borrower | Loan Amount |
|---|---|---|---|
| Open | Diaz Juan F | $82,800 | |
| Previous Owner | Diaz Juan F | $64,468 |
Source: Public Records
Tax History
| Year | Tax Paid | Tax Assessment Tax Assessment Total Assessment is a certain percentage of the fair market value that is determined by local assessors to be the total taxable value of land and additions on the property. | Land | Improvement |
|---|---|---|---|---|
| 2025 | $1,279 | $124,039 | $38,415 | $85,624 |
| 2023 | $1,279 | $119,224 | $36,924 | $82,300 |
| 2022 | $1,249 | $116,887 | $36,200 | $80,687 |
| 2021 | $1,229 | $114,596 | $35,491 | $79,105 |
| 2020 | $1,215 | $113,422 | $35,128 | $78,294 |
| 2019 | $1,197 | $111,199 | $34,440 | $76,759 |
| 2018 | $1,180 | $109,019 | $33,765 | $75,254 |
| 2017 | $1,110 | $106,882 | $33,103 | $73,779 |
| 2016 | $1,068 | $104,787 | $32,454 | $72,333 |
| 2015 | $1,079 | $103,214 | $31,967 | $71,247 |
| 2014 | $1,006 | $101,193 | $31,341 | $69,852 |
Source: Public Records
Map
Nearby Homes