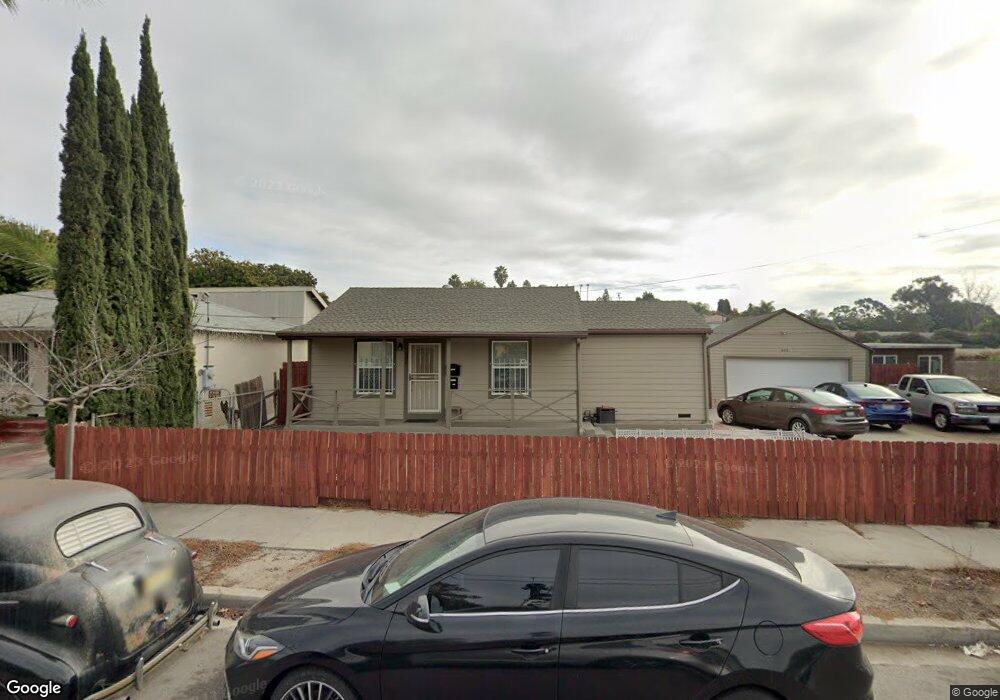
605 S Gregory St San Diego, CA 92113
Logan Heights NeighborhoodEstimated Value: $581,281 - $748,000
2
Beds
1
Bath
1,041
Sq Ft
$631/Sq Ft
Est. Value
About This Home
This home is located at 605 S Gregory St, San Diego, CA 92113 and is currently estimated at $657,070, approximately $631 per square foot. 605 S Gregory St is a home located in San Diego County with nearby schools including Rodriguez Elementary School, Logan Memorial Educational Campus, and King-Chavez Primary Academy.
Ownership History
Date
Name
Owned For
Owner Type
Purchase Details
Closed on
Nov 29, 2011
Sold by
Martin William R
Bought by
Benedetti Ruben O and Benedetti Vivien I
Current Estimated Value
Home Financials for this Owner
Home Financials are based on the most recent Mortgage that was taken out on this home.
Original Mortgage
$181,808
Outstanding Balance
$123,950
Interest Rate
3.94%
Mortgage Type
VA
Estimated Equity
$533,120
Purchase Details
Closed on
Aug 9, 2011
Sold by
The Secretary Of Housing & Urban Develop
Bought by
Martin William R
Purchase Details
Closed on
Sep 22, 2010
Sold by
Cimarron Service Corp Of Nevada
Bought by
The Secretary Of Housing & Urban Develop
Purchase Details
Closed on
Mar 28, 2003
Sold by
Ortega Mary G
Bought by
Ortega Mary G
Purchase Details
Closed on
Aug 9, 1996
Sold by
Ortega Mary G
Bought by
Ortega Mary Grace
Home Financials for this Owner
Home Financials are based on the most recent Mortgage that was taken out on this home.
Original Mortgage
$30,100
Interest Rate
8.23%
Mortgage Type
Balloon
Create a Home Valuation Report for This Property
The Home Valuation Report is an in-depth analysis detailing your home's value as well as a comparison with similar homes in the area
Home Values in the Area
Average Home Value in this Area
Purchase History
| Date | Buyer | Sale Price | Title Company |
|---|---|---|---|
| Benedetti Ruben O | $185,000 | Chicago Title Company | |
| Martin William R | $89,000 | Chicago Title Co | |
| The Secretary Of Housing & Urban Develop | $337,374 | First American Title | |
| Ortega Mary G | -- | -- | |
| Ortega Mary Grace | -- | Stewart Title Company |
Source: Public Records
Mortgage History
| Date | Status | Borrower | Loan Amount |
|---|---|---|---|
| Open | Benedetti Ruben O | $181,808 | |
| Previous Owner | Ortega Mary Grace | $30,100 |
Source: Public Records
Tax History
| Year | Tax Paid | Tax Assessment Tax Assessment Total Assessment is a certain percentage of the fair market value that is determined by local assessors to be the total taxable value of land and additions on the property. | Land | Improvement |
|---|---|---|---|---|
| 2025 | $2,747 | $232,356 | $130,538 | $101,818 |
| 2024 | $2,747 | $227,801 | $127,979 | $99,822 |
| 2023 | $2,684 | $223,335 | $125,470 | $97,865 |
| 2022 | $2,611 | $218,957 | $123,010 | $95,947 |
| 2021 | $2,592 | $214,665 | $120,599 | $94,066 |
| 2020 | $2,560 | $212,465 | $119,363 | $93,102 |
| 2019 | $2,513 | $208,300 | $117,023 | $91,277 |
| 2018 | $2,349 | $204,217 | $114,729 | $89,488 |
| 2017 | $2,292 | $200,214 | $112,480 | $87,734 |
| 2016 | $2,252 | $196,289 | $110,275 | $86,014 |
| 2015 | $2,218 | $193,341 | $108,619 | $84,722 |
| 2014 | $2,183 | $189,555 | $106,492 | $83,063 |
Source: Public Records
Map
Nearby Homes
- 534 S Gregory St Unit 40
- 3285 Ocean View Blvd Unit 19
- 3453-59 Ocean View Blvd
- 853 S 32nd St
- 21 33 S 35th St
- 3236 National Ave
- 220-22 S Pardee St
- 204-12 S Pardee St
- 3203 Webster Ave
- 3305 Steel St
- 402-8 Olivewood Terrace
- 3281 Steel St Unit 83
- 3260-64 Steel St
- 220 Southlook Ave
- 2949-55 Logan Ave
- 3691 National Ave
- 0 S 32nd St Unit 26650671
- 3667 Imperial Ave
- 0 Imperial Ave Unit 15/R
- 3521 Acacia St
- 601 S Gregory St
- 625 S Gregory St
- 539 S Gregory St
- 631-33 S Gregory St
- 631-33 S Gregory St Unit 631-633
- 633 S Gregory St
- 631 S Gregory St
- 620 S Gregory St
- 604 S Gregory St
- 610 S Gregory St Unit 14
- 529 S Gregory St Unit 33
- 628 S Gregory St
- 639 S Gregory St
- 638 S Gregory St
- 517 S Gregory St
- 611 S 33rd St
- 613 S 33rd St
- 605 S 33rd St
- 617 S 33rd St
- 705 S Gregory St
Your Personal Tour Guide
Ask me questions while you tour the home.