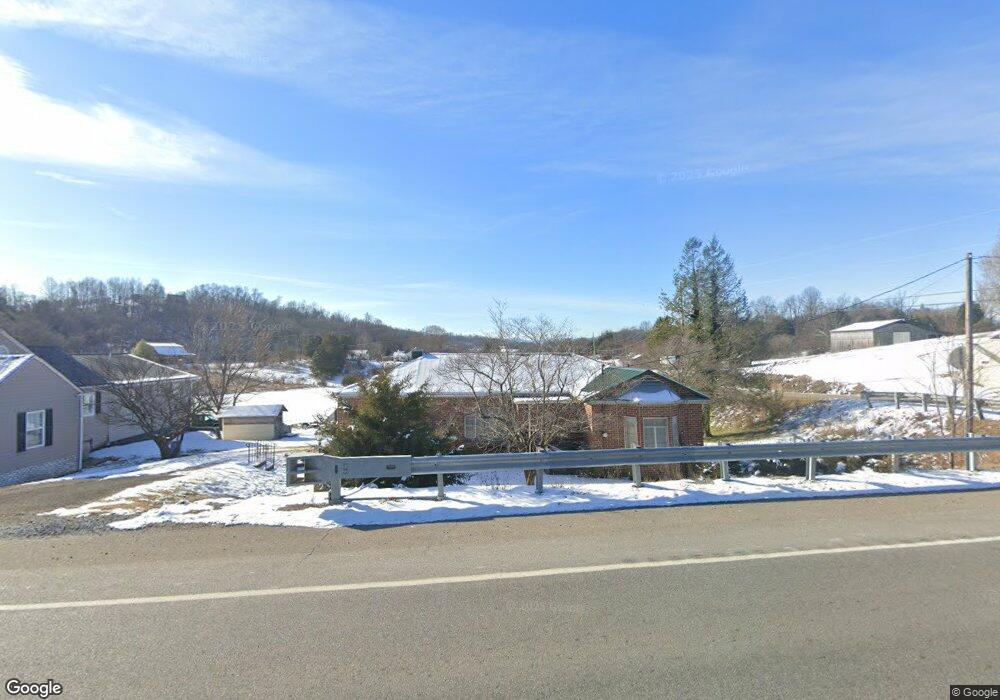
605 S Watauga Rd Watauga, TN 37694
Estimated Value: $273,930 - $315,000
--
Bed
1
Bath
1,581
Sq Ft
$186/Sq Ft
Est. Value
About This Home
This home is located at 605 S Watauga Rd, Watauga, TN 37694 and is currently estimated at $293,483, approximately $185 per square foot. 605 S Watauga Rd is a home with nearby schools including Elizabethton High School and East Tn Christian Home & Academy.
Ownership History
Date
Name
Owned For
Owner Type
Purchase Details
Closed on
Nov 27, 2017
Sold by
Whitehead Construction Inc
Bought by
Hutchins Michael E and Hutchins Madisons L
Current Estimated Value
Home Financials for this Owner
Home Financials are based on the most recent Mortgage that was taken out on this home.
Original Mortgage
$155,000
Outstanding Balance
$130,293
Interest Rate
3.88%
Mortgage Type
VA
Estimated Equity
$163,190
Purchase Details
Closed on
Sep 25, 2017
Sold by
Vance Debra J and Vance Wayne E
Bought by
Holston Habitat For Humanity Inc
Purchase Details
Closed on
Aug 2, 2017
Sold by
Whitehead Construction Inc
Bought by
Vance Debra J and Debra J Vance Living Trust
Purchase Details
Closed on
Jul 11, 2011
Sold by
Crockett John R
Bought by
Crockett Evelyn Jean Harvey
Purchase Details
Closed on
Jan 29, 1952
Bought by
Crockett John Raymond and Evelyn Jean
Purchase Details
Closed on
Nov 2, 1951
Purchase Details
Closed on
May 4, 1946
Create a Home Valuation Report for This Property
The Home Valuation Report is an in-depth analysis detailing your home's value as well as a comparison with similar homes in the area
Home Values in the Area
Average Home Value in this Area
Purchase History
| Date | Buyer | Sale Price | Title Company |
|---|---|---|---|
| Hutchins Michael E | $155,000 | Express & Closing Llc | |
| Holston Habitat For Humanity Inc | $45,000 | Heritage Title & Closing | |
| Vance Debra J | $10,000 | None Available | |
| Vance Debra J | $10,000 | None Available | |
| Crockett Evelyn Jean Harvey | -- | -- | |
| Crockett John Raymond | -- | -- | |
| -- | -- | -- | |
| -- | -- | -- |
Source: Public Records
Mortgage History
| Date | Status | Borrower | Loan Amount |
|---|---|---|---|
| Open | Hutchins Michael E | $155,000 |
Source: Public Records
Tax History Compared to Growth
Tax History
| Year | Tax Paid | Tax Assessment Tax Assessment Total Assessment is a certain percentage of the fair market value that is determined by local assessors to be the total taxable value of land and additions on the property. | Land | Improvement |
|---|---|---|---|---|
| 2024 | $1,426 | $43,225 | $12,325 | $30,900 |
| 2023 | $1,426 | $43,225 | $0 | $0 |
| 2022 | $1,556 | $43,225 | $12,325 | $30,900 |
| 2021 | $877 | $43,225 | $12,325 | $30,900 |
| 2020 | $1,490 | $43,225 | $12,325 | $30,900 |
| 2019 | $1,490 | $34,500 | $5,075 | $29,425 |
| 2018 | $1,470 | $34,500 | $5,075 | $29,425 |
| 2017 | $1,321 | $30,975 | $5,075 | $25,900 |
| 2016 | $1,315 | $31,025 | $10,800 | $20,225 |
| 2015 | $1,319 | $31,025 | $10,800 | $20,225 |
| 2014 | $1,342 | $31,425 | $10,800 | $20,625 |
Source: Public Records
Map
Nearby Homes
- 605 S Watauga Ave
- 608 Blevins Ave
- 609 S Watauga Ave
- 600 Blevins Ave
- 613 S Watauga Ave
- 605 Blevins Ave
- 603 S Watauga Ave
- 513 S Watauga Ave
- 616 Blevins Ave
- 603 Blevins Ave
- 0 Blevins Ave
- T.B.D Blevins Ave
- 510 Blevins Ave
- 615 S Watauga Ave
- 607 Blevins Ave
- 0 S Watauga Ave
- 729 S Watauga Ave
- lot 7 S Watauga Ave
- - S Watauga Ave
- 601 Blevins Ave