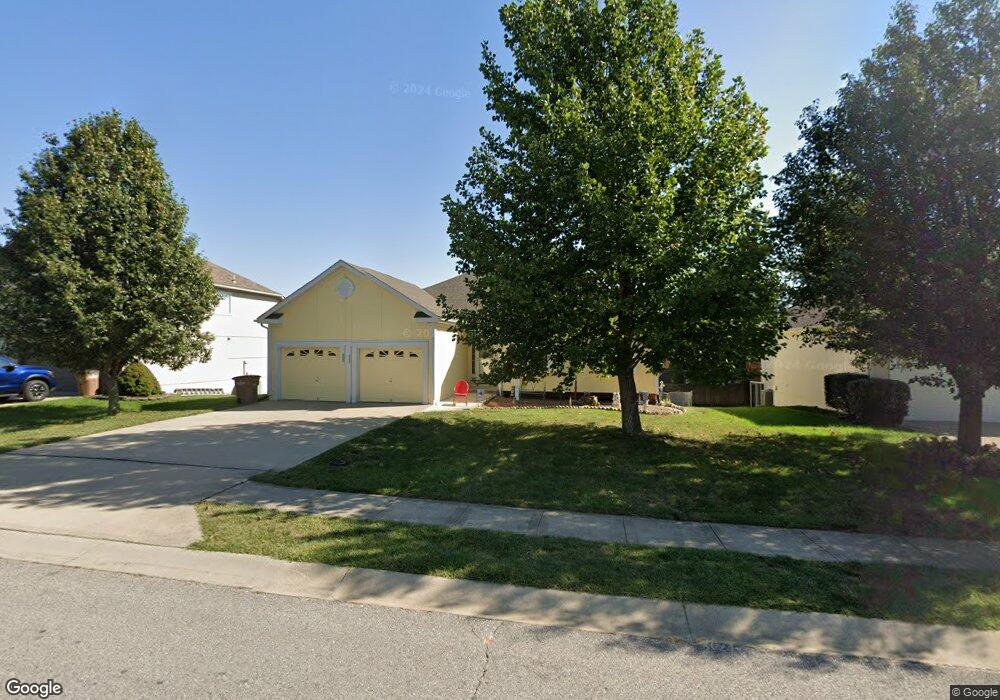
605 Seaton Blvd Raymore, MO 64083
Estimated Value: $345,850 - $388,000
3
Beds
2
Baths
1,574
Sq Ft
$234/Sq Ft
Est. Value
About This Home
This home is located at 605 Seaton Blvd, Raymore, MO 64083 and is currently estimated at $368,463, approximately $234 per square foot. 605 Seaton Blvd is a home located in Cass County with nearby schools including Creekmoor Elementary School, Raymore-Peculiar East Middle School, and Raymore-Peculiar Senior High School.
Ownership History
Date
Name
Owned For
Owner Type
Purchase Details
Closed on
Aug 25, 2025
Sold by
Zukel Kathy Dawn
Bought by
Zukel Kathy Dawn and Scheer Christina D
Current Estimated Value
Purchase Details
Closed on
Aug 9, 2021
Sold by
Collins Ferne C
Bought by
Plumbley Steven G and Plumbley Catherine L
Purchase Details
Closed on
Jul 20, 2016
Sold by
Collisn Ferne C
Bought by
Collins Ferne C
Purchase Details
Closed on
Jun 19, 2012
Sold by
Collins Ferne C
Bought by
Mcgraw M L and Collins Ferne C
Purchase Details
Closed on
May 21, 2010
Sold by
Collins Ferne C and Collins George L
Bought by
Collins Ferne C and Mcow Morton L
Purchase Details
Closed on
Mar 8, 2007
Sold by
Collins Ferne C
Bought by
Collins Ferne C and Ferne C Collins Declaration Of Trust
Create a Home Valuation Report for This Property
The Home Valuation Report is an in-depth analysis detailing your home's value as well as a comparison with similar homes in the area
Home Values in the Area
Average Home Value in this Area
Purchase History
| Date | Buyer | Sale Price | Title Company |
|---|---|---|---|
| Zukel Kathy Dawn | -- | None Listed On Document | |
| Plumbley Steven G | -- | None Available | |
| Collins Ferne C | -- | None Available | |
| Mcgraw M L | -- | None Available | |
| Collins Ferne C | -- | -- | |
| Collins Ferne C | -- | -- |
Source: Public Records
Tax History
| Year | Tax Paid | Tax Assessment Tax Assessment Total Assessment is a certain percentage of the fair market value that is determined by local assessors to be the total taxable value of land and additions on the property. | Land | Improvement |
|---|---|---|---|---|
| 2025 | $3,438 | $47,300 | $5,390 | $41,910 |
| 2024 | $3,438 | $42,250 | $4,890 | $37,360 |
| 2023 | $3,434 | $42,250 | $4,890 | $37,360 |
| 2022 | $3,012 | $36,820 | $4,890 | $31,930 |
| 2021 | $3,013 | $36,820 | $4,890 | $31,930 |
| 2020 | $2,954 | $35,460 | $4,890 | $30,570 |
| 2019 | $2,852 | $35,460 | $4,890 | $30,570 |
| 2018 | $2,635 | $31,640 | $3,980 | $27,660 |
| 2017 | $2,405 | $31,640 | $3,980 | $27,660 |
| 2016 | $2,405 | $29,980 | $3,980 | $26,000 |
| 2015 | $2,407 | $29,980 | $3,980 | $26,000 |
| 2014 | $2,408 | $29,980 | $3,980 | $26,000 |
| 2013 | -- | $29,980 | $3,980 | $26,000 |
Source: Public Records
Map
Nearby Homes
- 614 Foxglove Ln
- 602 Foxglove Ln
- 604 Foxglove Ln
- 502 Foxglove Ln
- 608 Foxglove Ln
- 710 Blazing Star Dr
- 610 Wild Lupine Ln
- 610 Foxglove Ln
- 604 Wild Lupine Ln
- 606 Foxglove Ln
- 708 Blazing Star Dr
- 609 Foxglove Ln
- 1217 Hampton Dr
- 706 Blazing Star Dr
- 705 Red Clover Ct
- 608 Wild Lupine Ln
- 701 Wood Sage Ct
- 707 Red Clover Ct
- 612 Wild Lupine Ln
- 611 Wild Lupine Ln
- 603 Seaton Blvd
- 607 Seaton Blvd
- 606 Johnston Pkwy
- 604 Johnston Pkwy
- 609 Seaton Blvd
- 601 Seaton Blvd
- 1013 Camelot Dr
- 602 Johnston Pkwy
- 611 Seaton Blvd
- 610 Johnston Pkwy
- 523 Seaton Blvd
- 1014 Camelot Dr
- 1015 Camelot Dr
- 522 Johnston Pkwy
- 1016 Manse Dr
- 521 Seaton Blvd
- 613 Seaton Blvd
- 612 Johnston Pkwy
- 1017 Camelot Dr
- 607 Johnston Pkwy
Your Personal Tour Guide
Ask me questions while you tour the home.