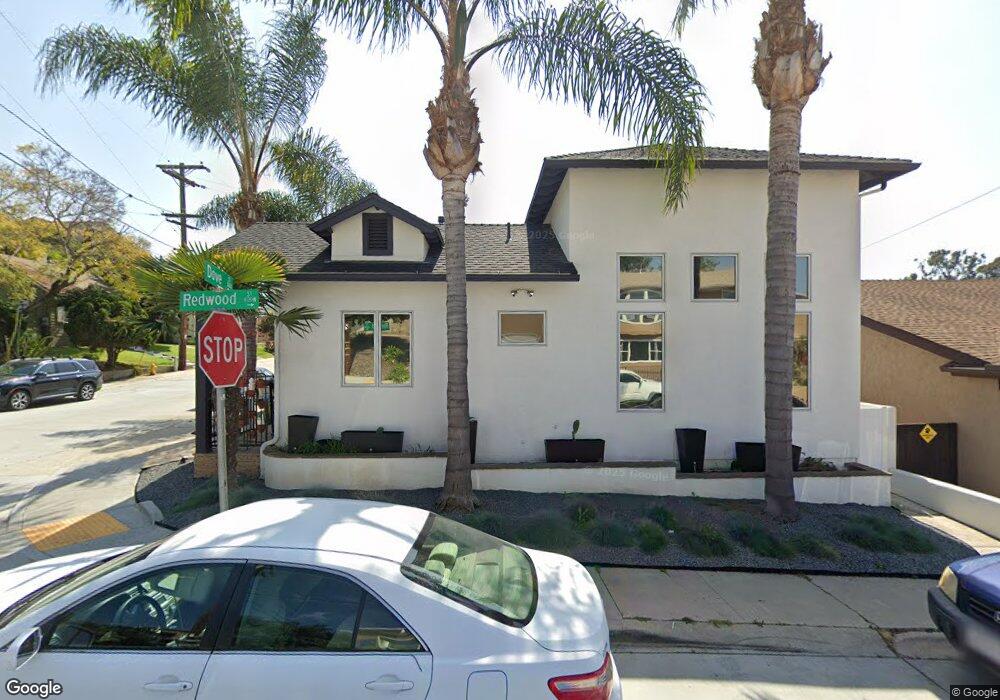
605 W Redwood St San Diego, CA 92103
Bankers Hill NeighborhoodEstimated Value: $1,800,323 - $2,129,000
3
Beds
3
Baths
2,300
Sq Ft
$843/Sq Ft
Est. Value
About This Home
This home is located at 605 W Redwood St, San Diego, CA 92103 and is currently estimated at $1,938,581, approximately $842 per square foot. 605 W Redwood St is a home located in San Diego County with nearby schools including Florence Elementary School, Roosevelt International Middle School, and Museum School.
Ownership History
Date
Name
Owned For
Owner Type
Purchase Details
Closed on
Jul 11, 2019
Sold by
Broderick Thomas William and Broderick Lisa M
Bought by
Munoz Monica Kimberly Kamantigue and Munoz Isaac Garcia
Current Estimated Value
Home Financials for this Owner
Home Financials are based on the most recent Mortgage that was taken out on this home.
Original Mortgage
$889,600
Outstanding Balance
$777,433
Interest Rate
3.7%
Mortgage Type
New Conventional
Estimated Equity
$1,161,148
Purchase Details
Closed on
Dec 18, 2008
Sold by
Broderick Thomas W and Broderick Lisa M
Bought by
Broderick Thomas W and Broderick Lisa M
Purchase Details
Closed on
Sep 5, 2000
Sold by
Scaglione Maria Revocable Trust
Bought by
Broderick Thomas W and Broderick Lisa M
Purchase Details
Closed on
Sep 24, 1996
Sold by
Maria Salvaggio and Scaglione Maria
Bought by
Scaglione Maria and 1996 Maria Scaglione Revocable Trust
Purchase Details
Closed on
Jul 28, 1986
Create a Home Valuation Report for This Property
The Home Valuation Report is an in-depth analysis detailing your home's value as well as a comparison with similar homes in the area
Home Values in the Area
Average Home Value in this Area
Purchase History
| Date | Buyer | Sale Price | Title Company |
|---|---|---|---|
| Munoz Monica Kimberly Kamantigue | $1,112,000 | Fidelity National Title | |
| Broderick Thomas W | -- | None Available | |
| Broderick Thomas W | $150,000 | American Title | |
| Scaglione Maria | -- | -- | |
| -- | $140,000 | -- |
Source: Public Records
Mortgage History
| Date | Status | Borrower | Loan Amount |
|---|---|---|---|
| Open | Munoz Monica Kimberly Kamantigue | $889,600 |
Source: Public Records
Tax History Compared to Growth
Tax History
| Year | Tax Paid | Tax Assessment Tax Assessment Total Assessment is a certain percentage of the fair market value that is determined by local assessors to be the total taxable value of land and additions on the property. | Land | Improvement |
|---|---|---|---|---|
| 2025 | $14,591 | $1,216,130 | $874,915 | $341,215 |
| 2024 | $14,591 | $1,192,285 | $857,760 | $334,525 |
| 2023 | $14,268 | $1,168,908 | $840,942 | $327,966 |
| 2022 | $13,887 | $1,145,989 | $824,453 | $321,536 |
| 2021 | $13,791 | $1,123,520 | $808,288 | $315,232 |
| 2020 | $13,622 | $1,112,000 | $800,000 | $312,000 |
| 2019 | $8,529 | $689,659 | $374,528 | $315,131 |
| 2018 | $7,974 | $676,137 | $367,185 | $308,952 |
| 2017 | $7,785 | $662,881 | $359,986 | $302,895 |
| 2016 | $7,661 | $649,884 | $352,928 | $296,956 |
| 2015 | $7,548 | $640,123 | $347,627 | $292,496 |
| 2014 | $7,430 | $627,585 | $340,818 | $286,767 |
Source: Public Records
Map
Nearby Homes
- 3206-16 Reynard Way
- 2948-54 Reynard Way
- 3109 Hawk St
- 2871 Brant St
- 2861 Brant St
- 2854 Albatross St
- 1034 W Quince St
- 3157 Harbor Ridge Ln Unit 2214
- 2805 State St
- 2730 Brant St
- 3467 Reynard Way Unit A
- 3266 1st Ave Unit 20
- 3025-37 Columbia St
- 1295 W Redwood St
- 3161 1st Ave Unit 3S
- 2961 1st Ave
- 3354 Hawk St
- 3320 Horton Ave
- 405 W Nutmeg St
- 2930 Columbia St Unit F