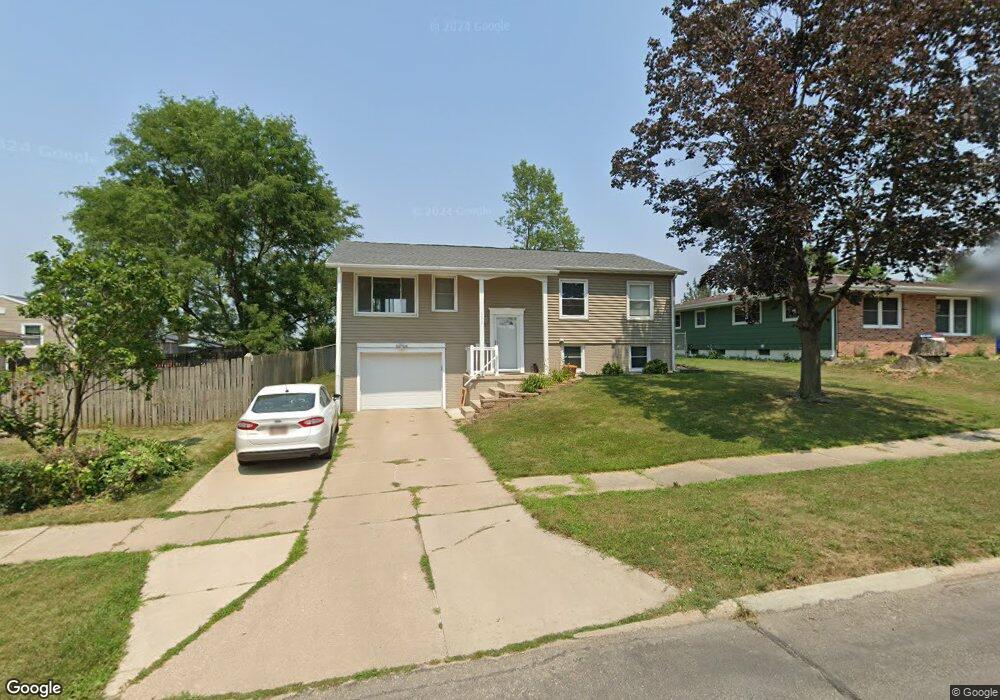
6050 Crestridge Ave SW Cedar Rapids, IA 52404
Cherry Hill Park NeighborhoodEstimated Value: $200,281 - $220,000
3
Beds
2
Baths
1,053
Sq Ft
$199/Sq Ft
Est. Value
About This Home
This home is located at 6050 Crestridge Ave SW, Cedar Rapids, IA 52404 and is currently estimated at $209,820, approximately $199 per square foot. 6050 Crestridge Ave SW is a home located in Linn County with nearby schools including Junction City Elementary School, West Willow Elementary School, and Bourbon Central Elementary School.
Ownership History
Date
Name
Owned For
Owner Type
Purchase Details
Closed on
Mar 29, 2005
Sold by
Siders Matthew T and Siders Kaye A
Bought by
Gahring Daniel A
Current Estimated Value
Home Financials for this Owner
Home Financials are based on the most recent Mortgage that was taken out on this home.
Original Mortgage
$107,350
Outstanding Balance
$54,893
Interest Rate
5.64%
Mortgage Type
Fannie Mae Freddie Mac
Estimated Equity
$154,927
Purchase Details
Closed on
Sep 20, 2001
Sold by
Steele Chris P and Steele Cathy A
Bought by
Siders Matthew T and Siders Kaye A
Home Financials for this Owner
Home Financials are based on the most recent Mortgage that was taken out on this home.
Original Mortgage
$87,920
Interest Rate
6.87%
Purchase Details
Closed on
Mar 28, 2001
Sold by
Berry Robert E
Bought by
Steele Chris P and Steele Cathy A
Home Financials for this Owner
Home Financials are based on the most recent Mortgage that was taken out on this home.
Original Mortgage
$85,618
Interest Rate
9%
Create a Home Valuation Report for This Property
The Home Valuation Report is an in-depth analysis detailing your home's value as well as a comparison with similar homes in the area
Home Values in the Area
Average Home Value in this Area
Purchase History
| Date | Buyer | Sale Price | Title Company |
|---|---|---|---|
| Gahring Daniel A | $112,500 | -- | |
| Siders Matthew T | $109,500 | -- | |
| Steele Chris P | $90,500 | -- |
Source: Public Records
Mortgage History
| Date | Status | Borrower | Loan Amount |
|---|---|---|---|
| Open | Gahring Daniel A | $107,350 | |
| Previous Owner | Siders Matthew T | $87,920 | |
| Previous Owner | Steele Chris P | $85,618 |
Source: Public Records
Tax History Compared to Growth
Tax History
| Year | Tax Paid | Tax Assessment Tax Assessment Total Assessment is a certain percentage of the fair market value that is determined by local assessors to be the total taxable value of land and additions on the property. | Land | Improvement |
|---|---|---|---|---|
| 2025 | $2,864 | $186,700 | $38,900 | $147,800 |
| 2024 | $3,112 | $171,700 | $34,100 | $137,600 |
| 2023 | $3,112 | $161,800 | $34,100 | $127,700 |
| 2022 | $3,032 | $147,500 | $29,200 | $118,300 |
| 2021 | $3,024 | $146,400 | $29,200 | $117,200 |
| 2020 | $3,024 | $137,100 | $26,000 | $111,100 |
| 2019 | $2,832 | $131,400 | $26,000 | $105,400 |
| 2018 | $2,572 | $131,400 | $26,000 | $105,400 |
| 2017 | $2,641 | $126,300 | $26,000 | $100,300 |
| 2016 | $2,641 | $124,300 | $26,000 | $98,300 |
| 2015 | $2,711 | $127,448 | $25,960 | $101,488 |
| 2014 | $2,526 | $127,448 | $25,960 | $101,488 |
| 2013 | $2,468 | $127,448 | $25,960 | $101,488 |
Source: Public Records
Map
Nearby Homes
- 6008 Eastview Ave SW
- 6118 Greenbriar Ln SW Unit D
- 6305 Greenbriar Ln SW Unit B
- 5918 Sharon Ln NW
- 164 Cherry Hill Rd NW
- 323 Norwick Rd SW
- 1590 Stoney Pt Rd & 6600 16th Ave SW
- 6812 Underwood Ave SW
- 200 Cherry Park Dr NW
- 150 Meadowlark Ln NW
- 6608 Limestone Ct NW
- 225 Rockvalley Ln NW
- 6907 Rock Wood Dr SW
- 509 Grey Slate Dr SW
- 106 Leroy St NW
- 6916 Rock Wood Dr SW
- 614 Grey Slate Dr SW
- 5127 Holly Ave NW
- 620 Grey Slate Dr SW
- 4975 Kesler Rd NW
- 6040 Crestridge Ave SW
- 221 Broadmore Rd SW
- 213 Broadmore Rd SW
- 6047 Westview Ave SW
- 6034 Crestridge Ave SW
- 6041 Westview Ave SW
- 205 Broadmore Rd SW
- 6035 Westview Ave SW
- 6047 Crestridge Ave SW
- 225 Broadmore Rd SW
- 6028 Crestridge Ave SW
- 6035 Crestridge Ave SW
- 6029 Westview Ave SW
- 227 Broadmore Rd SW
- 6106 Crestridge Ave SW
- 216 Broadmore Rd SW
- 6029 Crestridge Ave SW
- 6022 Crestridge Ave SW
- 6023 Westview Ave SW
- 208 Broadmore Rd SW