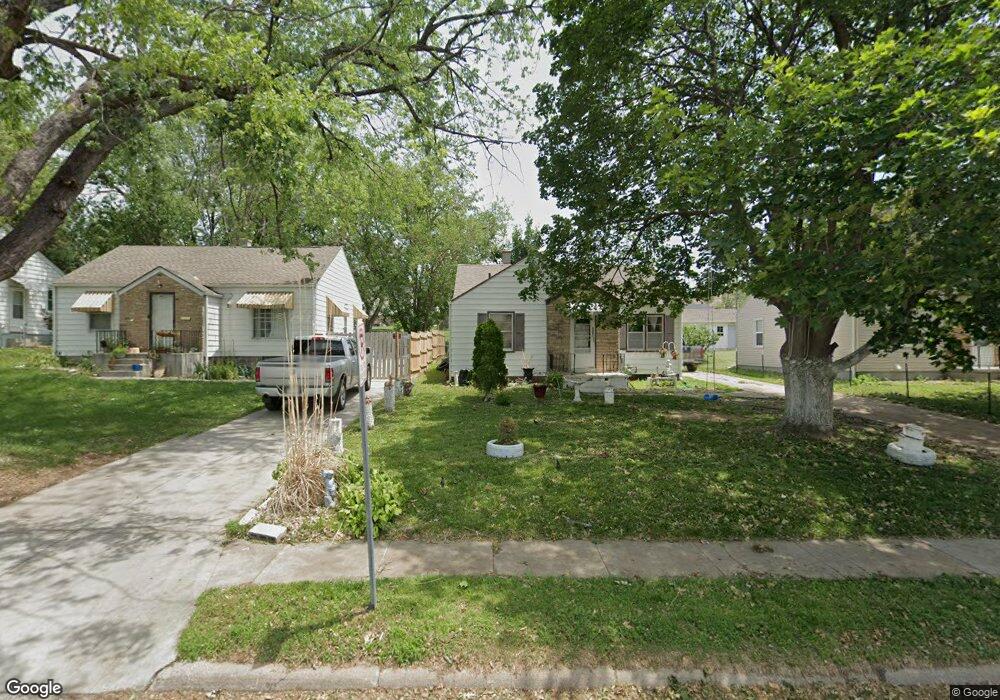
6051 S 41st St Omaha, NE 68107
South Central Omaha NeighborhoodEstimated Value: $179,000 - $210,000
2
Beds
1
Bath
1,038
Sq Ft
$186/Sq Ft
Est. Value
About This Home
This home is located at 6051 S 41st St, Omaha, NE 68107 and is currently estimated at $193,555, approximately $186 per square foot. 6051 S 41st St is a home located in Douglas County with nearby schools including Gateway Elementary School, Bryan High School, and Sts. Peter and Paul School.
Ownership History
Date
Name
Owned For
Owner Type
Purchase Details
Closed on
Apr 2, 2009
Sold by
Alexander Judith M
Bought by
Alatorre-Ortega Victor M
Current Estimated Value
Home Financials for this Owner
Home Financials are based on the most recent Mortgage that was taken out on this home.
Original Mortgage
$93,279
Outstanding Balance
$59,911
Interest Rate
5.24%
Mortgage Type
FHA
Estimated Equity
$133,644
Purchase Details
Closed on
Apr 25, 2005
Sold by
Mosier Jennifer L
Bought by
Alexander Judith M
Purchase Details
Closed on
Jul 30, 2002
Sold by
Baker Larry
Bought by
Mosier Jennifer L
Home Financials for this Owner
Home Financials are based on the most recent Mortgage that was taken out on this home.
Original Mortgage
$77,200
Interest Rate
6.6%
Mortgage Type
FHA
Create a Home Valuation Report for This Property
The Home Valuation Report is an in-depth analysis detailing your home's value as well as a comparison with similar homes in the area
Home Values in the Area
Average Home Value in this Area
Purchase History
| Date | Buyer | Sale Price | Title Company |
|---|---|---|---|
| Alatorre-Ortega Victor M | $95,000 | -- | |
| Alexander Judith M | $92,900 | -- | |
| Mosier Jennifer L | $78,000 | -- |
Source: Public Records
Mortgage History
| Date | Status | Borrower | Loan Amount |
|---|---|---|---|
| Open | Alatorre-Ortega Victor M | $93,279 | |
| Previous Owner | Mosier Jennifer L | $77,200 |
Source: Public Records
Tax History Compared to Growth
Tax History
| Year | Tax Paid | Tax Assessment Tax Assessment Total Assessment is a certain percentage of the fair market value that is determined by local assessors to be the total taxable value of land and additions on the property. | Land | Improvement |
|---|---|---|---|---|
| 2024 | $3,232 | $155,500 | $12,700 | $142,800 |
| 2023 | $3,232 | $153,200 | $12,700 | $140,500 |
| 2022 | $2,463 | $115,400 | $10,800 | $104,600 |
| 2021 | $2,443 | $115,400 | $10,800 | $104,600 |
| 2020 | $2,100 | $98,100 | $10,800 | $87,300 |
| 2019 | $1,971 | $91,800 | $10,800 | $81,000 |
| 2018 | $1,974 | $91,800 | $10,800 | $81,000 |
| 2017 | $1,975 | $91,400 | $6,600 | $84,800 |
| 2016 | $1,961 | $91,400 | $6,600 | $84,800 |
| 2015 | $1,935 | $91,400 | $6,600 | $84,800 |
| 2014 | $1,935 | $91,400 | $6,600 | $84,800 |
Source: Public Records
Map
Nearby Homes