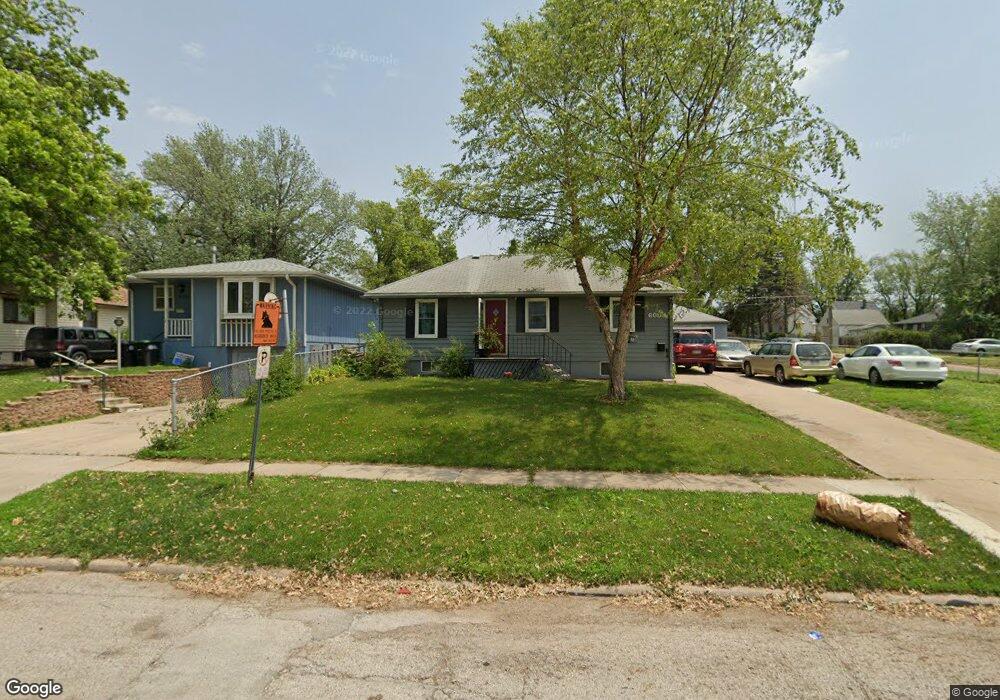
6053 S 39th St Omaha, NE 68107
South Central Omaha NeighborhoodEstimated Value: $182,000 - $219,000
2
Beds
2
Baths
843
Sq Ft
$236/Sq Ft
Est. Value
About This Home
This home is located at 6053 S 39th St, Omaha, NE 68107 and is currently estimated at $199,273, approximately $236 per square foot. 6053 S 39th St is a home located in Douglas County with nearby schools including Gateway Elementary School, Bryan High School, and St. Bernadette School.
Ownership History
Date
Name
Owned For
Owner Type
Purchase Details
Closed on
Jul 17, 2011
Sold by
Mertz Thomas J and Hunter Ann Marie
Bought by
Barbosa Yosemite
Current Estimated Value
Home Financials for this Owner
Home Financials are based on the most recent Mortgage that was taken out on this home.
Original Mortgage
$85,769
Outstanding Balance
$59,671
Interest Rate
4.75%
Mortgage Type
FHA
Estimated Equity
$139,602
Purchase Details
Closed on
Jun 8, 2007
Sold by
Palmer Stella
Bought by
Mertz Thomas J
Create a Home Valuation Report for This Property
The Home Valuation Report is an in-depth analysis detailing your home's value as well as a comparison with similar homes in the area
Home Values in the Area
Average Home Value in this Area
Purchase History
| Date | Buyer | Sale Price | Title Company |
|---|---|---|---|
| Barbosa Yosemite | $88,000 | Clean Title & Escrow Llc | |
| Mertz Thomas J | $79,000 | -- |
Source: Public Records
Mortgage History
| Date | Status | Borrower | Loan Amount |
|---|---|---|---|
| Open | Barbosa Yosemite | $85,769 |
Source: Public Records
Tax History Compared to Growth
Tax History
| Year | Tax Paid | Tax Assessment Tax Assessment Total Assessment is a certain percentage of the fair market value that is determined by local assessors to be the total taxable value of land and additions on the property. | Land | Improvement |
|---|---|---|---|---|
| 2024 | $3,053 | $159,900 | $17,000 | $142,900 |
| 2023 | $3,053 | $144,700 | $17,000 | $127,700 |
| 2022 | $2,442 | $114,400 | $11,500 | $102,900 |
| 2021 | $2,421 | $114,400 | $11,500 | $102,900 |
| 2020 | $2,087 | $97,500 | $11,500 | $86,000 |
| 2019 | $1,928 | $89,800 | $11,500 | $78,300 |
| 2018 | $1,931 | $89,800 | $11,500 | $78,300 |
| 2017 | $1,761 | $81,500 | $8,400 | $73,100 |
| 2016 | $1,749 | $81,500 | $8,400 | $73,100 |
| 2015 | $1,725 | $81,500 | $8,400 | $73,100 |
| 2014 | $1,725 | $81,500 | $8,400 | $73,100 |
Source: Public Records
Map
Nearby Homes