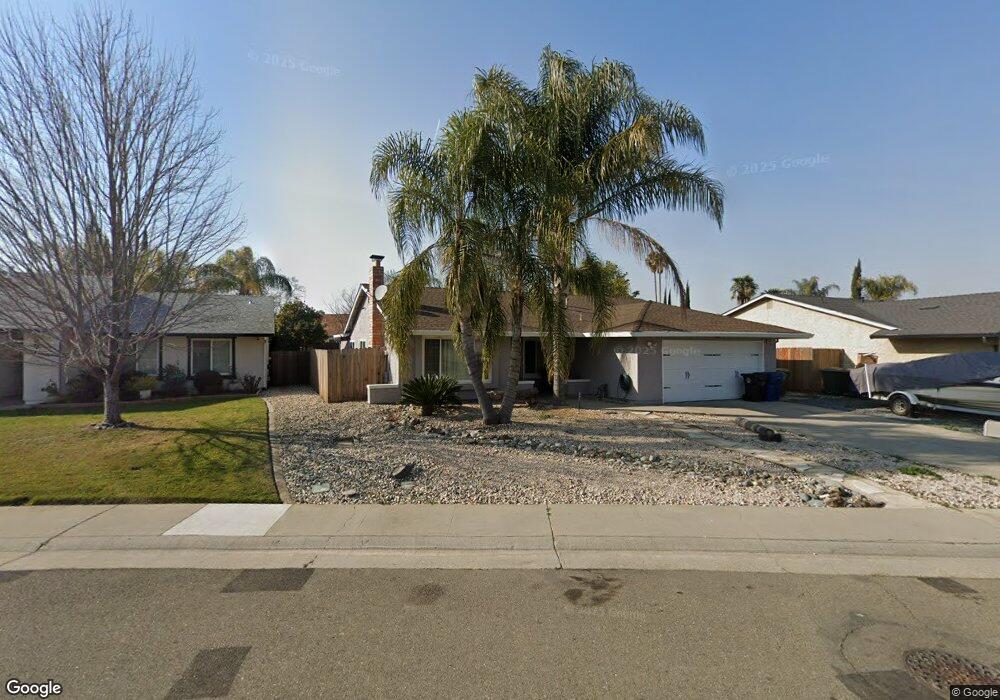
6055 Sierravale Way Citrus Heights, CA 95621
Estimated Value: $338,000 - $492,646
1
Bed
2
Baths
--
Sq Ft
6,970
Sq Ft Lot
About This Home
This home is located at 6055 Sierravale Way, Citrus Heights, CA 95621 and is currently estimated at $449,162. 6055 Sierravale Way is a home located in Sacramento County with nearby schools including Grand Oaks Elementary School, Sylvan Middle School, and Mesa Verde High School.
Ownership History
Date
Name
Owned For
Owner Type
Purchase Details
Closed on
Dec 31, 2019
Sold by
Bobbit Monica Collins
Bought by
Bobbit Monica Collins and Bobbit Dwayne Maurice
Current Estimated Value
Purchase Details
Closed on
Nov 15, 2019
Sold by
Erickson Geneva Mae and Erickson Geneva M
Bought by
Maitino Robin
Purchase Details
Closed on
Mar 6, 2012
Sold by
Roberts Monica Collins
Bought by
Collins Monica Linda
Purchase Details
Closed on
Mar 5, 2009
Sold by
Roberts Shannon R
Bought by
Roberts Monica Collins
Purchase Details
Closed on
May 23, 2005
Sold by
Bennett Enoch
Bought by
Roberts Shannon R and Roberts Monica C
Home Financials for this Owner
Home Financials are based on the most recent Mortgage that was taken out on this home.
Original Mortgage
$305,910
Interest Rate
7.2%
Mortgage Type
Fannie Mae Freddie Mac
Create a Home Valuation Report for This Property
The Home Valuation Report is an in-depth analysis detailing your home's value as well as a comparison with similar homes in the area
Home Values in the Area
Average Home Value in this Area
Purchase History
| Date | Buyer | Sale Price | Title Company |
|---|---|---|---|
| Bobbit Monica Collins | -- | None Available | |
| Bobbit Monica Collins | -- | None Available | |
| Maitino Robin | -- | Placer Title Company | |
| Collins Monica Linda | -- | None Available | |
| Roberts Monica Collins | -- | None Available | |
| Roberts Shannon R | $340,000 | Financial Title Company |
Source: Public Records
Mortgage History
| Date | Status | Borrower | Loan Amount |
|---|---|---|---|
| Previous Owner | Roberts Shannon R | $305,910 |
Source: Public Records
Tax History Compared to Growth
Tax History
| Year | Tax Paid | Tax Assessment Tax Assessment Total Assessment is a certain percentage of the fair market value that is determined by local assessors to be the total taxable value of land and additions on the property. | Land | Improvement |
|---|---|---|---|---|
| 2025 | $4,199 | $354,703 | $127,900 | $226,803 |
| 2024 | $4,199 | $347,749 | $125,393 | $222,356 |
| 2023 | $4,093 | $340,932 | $122,935 | $217,997 |
| 2022 | $4,072 | $334,248 | $120,525 | $213,723 |
| 2021 | $4,005 | $327,695 | $118,162 | $209,533 |
| 2020 | $3,930 | $324,336 | $116,951 | $207,385 |
| 2019 | $3,936 | $317,977 | $114,658 | $203,319 |
| 2018 | $3,890 | $311,743 | $112,410 | $199,333 |
| 2017 | $3,770 | $305,631 | $110,206 | $195,425 |
| 2016 | $3,441 | $299,640 | $108,046 | $191,594 |
| 2015 | $3,141 | $274,531 | $106,106 | $168,425 |
| 2014 | $2,985 | $261,458 | $101,053 | $160,405 |
Source: Public Records
Map
Nearby Homes
- 7401 Springvale Way
- 6004 Windlass Ct
- 7225 Catamaran Dr
- 7448 Blackthorne Way
- 7128 Parkvale Way
- 7101 Schooner Way
- 7439 Saybrook Dr
- 7449 Mar Vista Way
- 7068 Skokie Place
- 7512 Bufflehead Ln
- 7516 Scaup Ln
- 6336 Twin Wood Way
- 5832 Alameda Ln Unit 138
- 7032 Sunburst Way
- 6133 Glenhurst Way
- 7533 Pintail Cir
- 6941 Radiance Cir
- 7428 White River Ln Unit 175
- 7236 Ojai Ct
- 6508 Skylane Dr
- 6059 Sierravale Way
- 6051 Sierravale Way
- 7248 Lillivale Ct
- 7244 Lillivale Ct
- 6063 Sierravale Way
- 6035 Sierravale Way
- 6054 Sierravale Way
- 6050 Sierravale Way
- 7252 Lilillivale Ct
- 7252 Lillivale Ct
- 6031 Sierravale Way
- 6058 Sierravale Way
- 6067 Sierravale Way
- 7256 Lillivale Ct
- 6027 Sierravale Way
- 6062 Sierravale Way
- 6100 Tupelo Dr
- 6042 Sierravale Way
- 6023 Sierravale Way
- 7243 Lillivale Ct