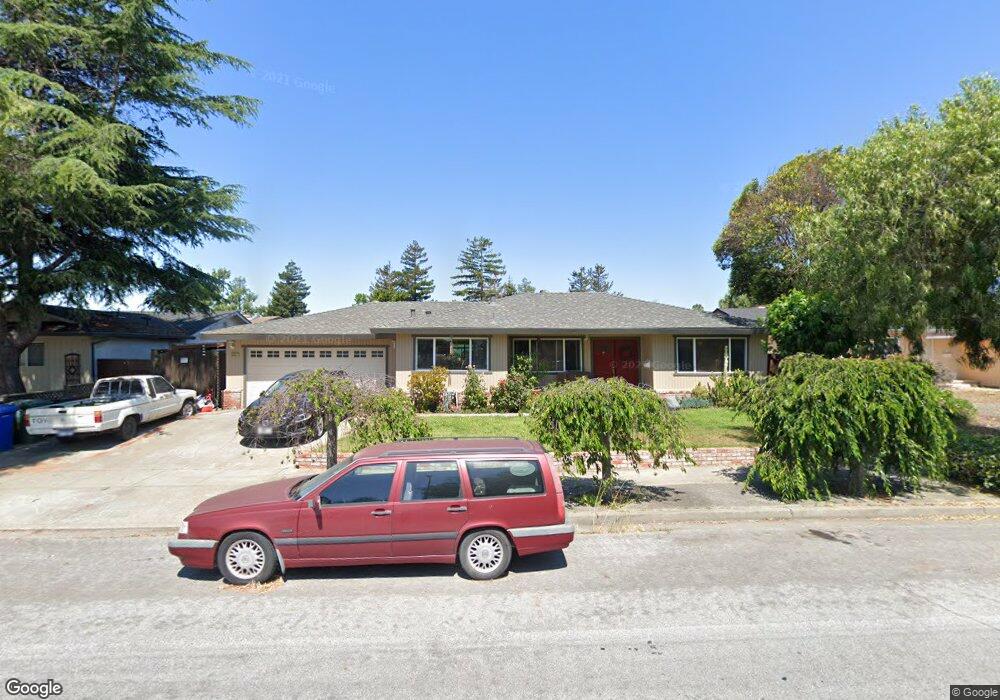
6057 Moores Ave Newark, CA 94560
Birch Grove NeighborhoodEstimated Value: $1,438,000 - $1,735,000
3
Beds
2
Baths
1,797
Sq Ft
$881/Sq Ft
Est. Value
About This Home
This home is located at 6057 Moores Ave, Newark, CA 94560 and is currently estimated at $1,582,745, approximately $880 per square foot. 6057 Moores Ave is a home located in Alameda County with nearby schools including Birch Grove Primary School, Newark Junior High School, and Newark Memorial High School.
Ownership History
Date
Name
Owned For
Owner Type
Purchase Details
Closed on
Jun 1, 2001
Sold by
Florio Joseph William
Bought by
Florio Joseph W and Florio Mary M
Current Estimated Value
Home Financials for this Owner
Home Financials are based on the most recent Mortgage that was taken out on this home.
Original Mortgage
$325,500
Outstanding Balance
$123,989
Interest Rate
7.14%
Estimated Equity
$1,458,756
Purchase Details
Closed on
Apr 27, 1998
Sold by
Florio Mary
Bought by
Florio Joseph William
Home Financials for this Owner
Home Financials are based on the most recent Mortgage that was taken out on this home.
Original Mortgage
$250,000
Interest Rate
7.13%
Purchase Details
Closed on
Jun 14, 1995
Sold by
Pia Phillip A and Pia Patricia A
Bought by
Pia Raymond E and Pia Kristina L
Create a Home Valuation Report for This Property
The Home Valuation Report is an in-depth analysis detailing your home's value as well as a comparison with similar homes in the area
Home Values in the Area
Average Home Value in this Area
Purchase History
| Date | Buyer | Sale Price | Title Company |
|---|---|---|---|
| Florio Joseph W | -- | Commonwealth Land Title Co | |
| Florio Joseph William | -- | First American Title Guarant | |
| Florio Joseph William | $250,000 | First American Title Guarant | |
| Pia Raymond E | -- | American Title |
Source: Public Records
Mortgage History
| Date | Status | Borrower | Loan Amount |
|---|---|---|---|
| Open | Florio Joseph W | $325,500 | |
| Closed | Florio Joseph William | $250,000 |
Source: Public Records
Tax History Compared to Growth
Tax History
| Year | Tax Paid | Tax Assessment Tax Assessment Total Assessment is a certain percentage of the fair market value that is determined by local assessors to be the total taxable value of land and additions on the property. | Land | Improvement |
|---|---|---|---|---|
| 2025 | $5,190 | $392,167 | $119,750 | $279,417 |
| 2024 | $5,190 | $384,341 | $117,402 | $273,939 |
| 2023 | $5,038 | $383,670 | $115,101 | $268,569 |
| 2022 | $4,959 | $369,147 | $112,844 | $263,303 |
| 2021 | $4,837 | $361,771 | $110,631 | $258,140 |
| 2020 | $4,731 | $364,991 | $109,497 | $255,494 |
| 2019 | $4,665 | $357,837 | $107,351 | $250,486 |
| 2018 | $4,592 | $350,821 | $105,246 | $245,575 |
| 2017 | $4,474 | $343,944 | $103,183 | $240,761 |
| 2016 | $4,418 | $337,201 | $101,160 | $236,041 |
| 2015 | $4,402 | $332,137 | $99,641 | $232,496 |
| 2014 | $4,279 | $325,631 | $97,689 | $227,942 |
Source: Public Records
Map
Nearby Homes
- 5965 Moores Ave
- 38393 Amaryllis Place
- 38466 Ambrosia St
- 38496 Ambrosia St
- 38532 Cedar Blvd
- Sierra Plan at Marabel
- Olvera Plan at Marabel
- Ronda Plan at Marabel
- Medina Plan at Marabel
- Sidonia Plan at Marabel
- 5550 Higo Way
- 5562 Higo Way
- 6251 Quartz Place
- 38984 Primula Terrace
- 38976 Primula Terrace
- 6065 Robertson Ave
- 6429 Robertson Ave
- 37643 Crocus Ct
- 37880 Farwell Dr
- 6176 Thomas Ave
- 6045 Moores Ave
- 6069 Moores Ave
- 6020 Peppertree Ct
- 6028 Peppertree Ct
- 6016 Peppertree Ct
- 38628 Quince Place
- 6033 Moores Ave
- 6081 Moores Ave
- 6034 Peppertree Ct
- 6010 Peppertree Ct
- 6096 Moores Ave
- 38631 Quince Place
- 38662 Quince Place
- 6040 Peppertree Ct
- 6093 Moores Ave
- 6021 Moores Ave
- 6074 Moores Ave
- 38653 Quince Place
- 6019 Peppertree Ct
- 6023 Peppertree Ct