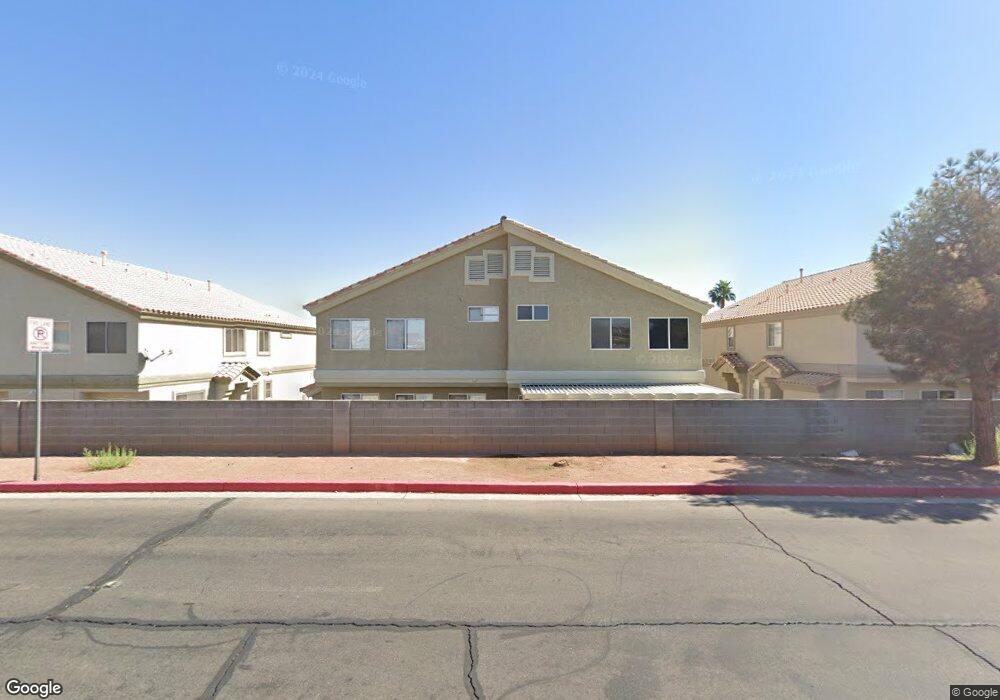
6057 Slow Bob St Unit 102 Henderson, NV 89011
Midway NeighborhoodEstimated Value: $283,000 - $321,000
2
Beds
3
Baths
1,417
Sq Ft
$216/Sq Ft
Est. Value
About This Home
This home is located at 6057 Slow Bob St Unit 102, Henderson, NV 89011 and is currently estimated at $306,125, approximately $216 per square foot. 6057 Slow Bob St Unit 102 is a home located in Clark County with nearby schools including Harriet Treem Elementary School, Jim Thorpe Elementary School, and Francis H Cortney Junior High School.
Ownership History
Date
Name
Owned For
Owner Type
Purchase Details
Closed on
Jan 6, 2017
Sold by
Schneider Gustavo F and Schneider Nohora J
Bought by
Kirakossian Giovany
Current Estimated Value
Purchase Details
Closed on
Jun 25, 2010
Sold by
Central Mortgage Company
Bought by
Kirakossian Giovany
Purchase Details
Closed on
Apr 8, 2010
Sold by
Hodge Janine
Bought by
Central Mortgage Company
Purchase Details
Closed on
Jan 30, 2006
Sold by
Sanchez Leon
Bought by
Hodge Janine
Home Financials for this Owner
Home Financials are based on the most recent Mortgage that was taken out on this home.
Original Mortgage
$184,000
Interest Rate
6.75%
Mortgage Type
Unknown
Purchase Details
Closed on
Jul 12, 2001
Sold by
D R Horton Inc
Bought by
Sanchez Leon
Home Financials for this Owner
Home Financials are based on the most recent Mortgage that was taken out on this home.
Original Mortgage
$58,900
Interest Rate
7.26%
Create a Home Valuation Report for This Property
The Home Valuation Report is an in-depth analysis detailing your home's value as well as a comparison with similar homes in the area
Home Values in the Area
Average Home Value in this Area
Purchase History
| Date | Buyer | Sale Price | Title Company |
|---|---|---|---|
| Kirakossian Giovany | -- | None Available | |
| Kirakossian Giovany | $75,000 | Noble Title | |
| Central Mortgage Company | $88,000 | Accommodation | |
| Hodge Janine | $230,000 | First Amer Title Co Of Nv | |
| Sanchez Leon | $101,040 | United Title |
Source: Public Records
Mortgage History
| Date | Status | Borrower | Loan Amount |
|---|---|---|---|
| Previous Owner | Hodge Janine | $184,000 | |
| Previous Owner | Sanchez Leon | $58,900 |
Source: Public Records
Tax History Compared to Growth
Tax History
| Year | Tax Paid | Tax Assessment Tax Assessment Total Assessment is a certain percentage of the fair market value that is determined by local assessors to be the total taxable value of land and additions on the property. | Land | Improvement |
|---|---|---|---|---|
| 2025 | $1,161 | $70,758 | $18,900 | $51,858 |
| 2024 | $1,076 | $70,758 | $18,900 | $51,858 |
| 2023 | $1,076 | $69,601 | $22,400 | $47,201 |
| 2022 | $996 | $63,044 | $18,200 | $44,844 |
| 2021 | $923 | $52,554 | $16,100 | $36,454 |
| 2020 | $854 | $54,189 | $16,100 | $38,089 |
| 2019 | $800 | $51,109 | $13,300 | $37,809 |
| 2018 | $764 | $46,267 | $10,150 | $36,117 |
| 2017 | $1,315 | $44,616 | $8,750 | $35,866 |
| 2016 | $716 | $41,847 | $7,350 | $34,497 |
| 2015 | $714 | $38,344 | $5,250 | $33,094 |
| 2014 | $692 | $24,715 | $4,375 | $20,340 |
Source: Public Records
Map
Nearby Homes
- 6255 Dan Blocker Ave Unit 101
- 6371 Lorne Green Ave Unit 103
- 1179 Heliodor Ave
- 6370 Rusticated Stone Ave Unit 102
- 1180 Heliodor Ave
- 6064 Nestled Foot St Unit 102
- 1163 Heliodor Ave Unit lot 170
- 5969 High Steed St Unit 101
- 1144 Heliodor Ave
- 1175 Heliodor Ave
- 879 Apatite Place
- 1171 Heliodor Ave
- 1151 Heliodor Ave
- 1160 Heliodor Ave
- 1156 Heliodor Ave
- 1148 Heliodor Ave
- 891 Apatite Place
- Bedford Plan at Jasper Point
- Barclay Plan at Jasper Point
- Griffin Plan at Jasper Point
- 6057 Slow Bob St Unit 103
- 6057 Slow Bob St Unit 101
- 6047 Slow Bob St Unit 102
- 6047 Slow Bob St Unit 101
- 6047 Slow Bob St Unit 103
- 6067 Slow Bob St Unit 102
- 6067 Slow Bob St Unit 103
- 6067 Slow Bob St Unit 101
- 6037 Crumbling Ridge St
- 6077 Slow Bob St Unit 102
- 6077 Slow Bob St Unit 101
- 6077 Slow Bob St Unit 103
- 6222 Ordaz Ave Unit 102
- 6222 Ordaz Ave Unit 103
- 6223 Ordaz Ave Unit 103
- 6223 Ordaz Ave Unit 102
- 6223 Ordaz Ave Unit 101
- 6027 Crumbling Ridge St
- 6217 Overhang Ave
- 6232 Ordaz Ave Unit 103