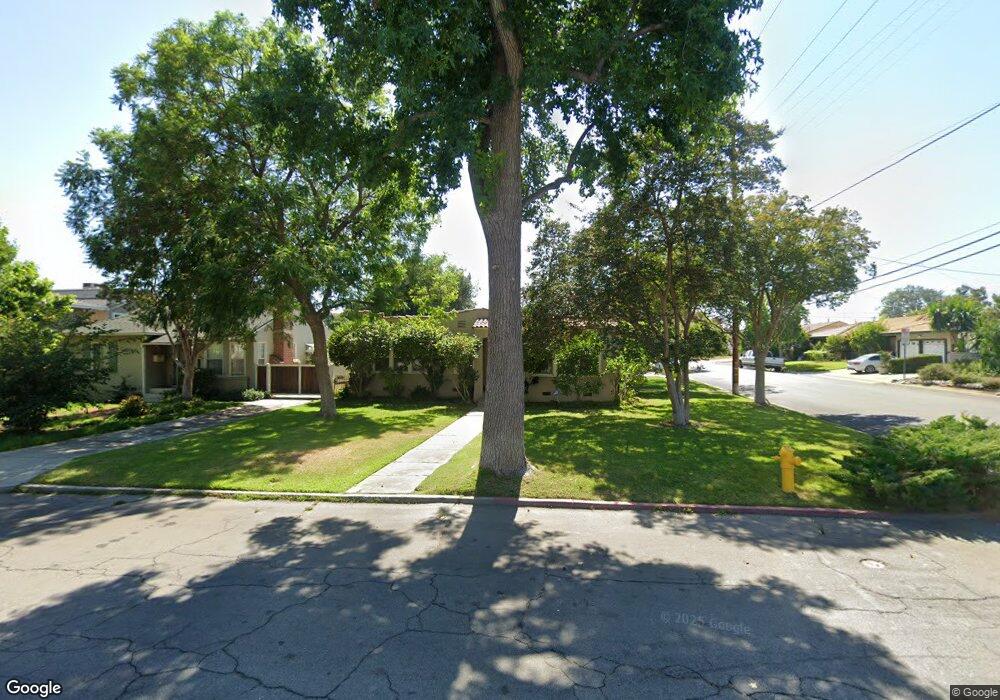
6059 Camellia Ave Temple City, CA 91780
Estimated Value: $1,020,000 - $1,208,000
2
Beds
1
Bath
1,612
Sq Ft
$690/Sq Ft
Est. Value
About This Home
This home is located at 6059 Camellia Ave, Temple City, CA 91780 and is currently estimated at $1,111,518, approximately $689 per square foot. 6059 Camellia Ave is a home located in Los Angeles County with nearby schools including Longden Elementary School, Oak Avenue Intermediate School, and Temple City High School.
Ownership History
Date
Name
Owned For
Owner Type
Purchase Details
Closed on
Dec 7, 2015
Sold by
Dong Lingyu
Bought by
Gao Zhanhua
Current Estimated Value
Purchase Details
Closed on
Mar 6, 2009
Sold by
Pfister Julie
Bought by
Gao Zhanhua
Home Financials for this Owner
Home Financials are based on the most recent Mortgage that was taken out on this home.
Original Mortgage
$415,000
Interest Rate
5.04%
Mortgage Type
Purchase Money Mortgage
Purchase Details
Closed on
Aug 7, 1999
Sold by
Walbridge Family Trust and Lyle
Bought by
Pfister Julie
Home Financials for this Owner
Home Financials are based on the most recent Mortgage that was taken out on this home.
Original Mortgage
$201,300
Interest Rate
3.95%
Purchase Details
Closed on
Mar 10, 1994
Sold by
Walbridge Lucille Larson
Bought by
Walbridge Donavon J
Create a Home Valuation Report for This Property
The Home Valuation Report is an in-depth analysis detailing your home's value as well as a comparison with similar homes in the area
Home Values in the Area
Average Home Value in this Area
Purchase History
| Date | Buyer | Sale Price | Title Company |
|---|---|---|---|
| Gao Zhanhua | -- | None Available | |
| Gao Zhanhua | $535,000 | Lawyers Title Company | |
| Pfister Julie | $224,000 | Southland Title Corporation | |
| Walbridge Donavon J | -- | -- |
Source: Public Records
Mortgage History
| Date | Status | Borrower | Loan Amount |
|---|---|---|---|
| Previous Owner | Gao Zhanhua | $415,000 | |
| Previous Owner | Pfister Julie | $201,300 |
Source: Public Records
Tax History Compared to Growth
Tax History
| Year | Tax Paid | Tax Assessment Tax Assessment Total Assessment is a certain percentage of the fair market value that is determined by local assessors to be the total taxable value of land and additions on the property. | Land | Improvement |
|---|---|---|---|---|
| 2025 | $8,578 | $727,872 | $463,585 | $264,287 |
| 2024 | $8,578 | $713,601 | $454,496 | $259,105 |
| 2023 | $8,383 | $699,610 | $445,585 | $254,025 |
| 2022 | $7,843 | $685,894 | $436,849 | $249,045 |
| 2021 | $7,986 | $672,446 | $428,284 | $244,162 |
| 2019 | $7,697 | $652,503 | $415,582 | $236,921 |
| 2018 | $7,502 | $639,710 | $407,434 | $232,276 |
| 2016 | $7,237 | $614,871 | $391,614 | $223,257 |
| 2015 | $7,064 | $605,636 | $385,732 | $219,904 |
| 2014 | $6,958 | $593,774 | $378,177 | $215,597 |
Source: Public Records
Map
Nearby Homes
- 9711 Garibaldi Ave
- 6119 Temple City Blvd
- 6226 Primrose Ave
- 9665 Longden Ave
- 6022 Rowland Ave
- 6204 Oak Ave
- 6037 Oak Ave
- 5929 Oak Ave
- 5819 Baldwin Ave Unit C
- 639 W Longden Ave
- 5716 Alessandro Ave
- 9861 E Lemon Ave
- 5530 Alessandro Ave
- 2015 Bella Vista Ave
- 6639 Barela Ave
- 9618 E Camino Real Ave
- 6227 Sultana Ave
- 6433 Livia Ave
- 662 W Norman Ave
- 0 Sultana Ave
- 6053 Camellia Ave
- 9620 Garibaldi Ave
- 6101 Camellia Ave
- 9625 Garibaldi Ave
- 9616 Garibaldi Ave
- 6047 Camellia Ave Unit I
- 6047 Camellia Ave Unit K
- 6047 Camellia Ave Unit N
- 6047 Camellia Ave Unit M
- 6047 Camellia Ave Unit L
- 6047 Camellia Ave Unit 11K
- 6047 Camellia Ave Unit J
- 6047 Camellia Ave Unit 1
- 6047 Camellia Ave Unit H
- 6047 Camellia Ave Unit G
- 6047 Camellia Ave Unit F
- 6047 Camellia Ave Unit E
- 6047 Camellia Ave Unit D
- 6047 Camellia Ave Unit C
- 6047 Camellia Ave Unit B