Estimated Value: $383,000 - $521,000
4
Beds
3
Baths
2,922
Sq Ft
$153/Sq Ft
Est. Value
About This Home
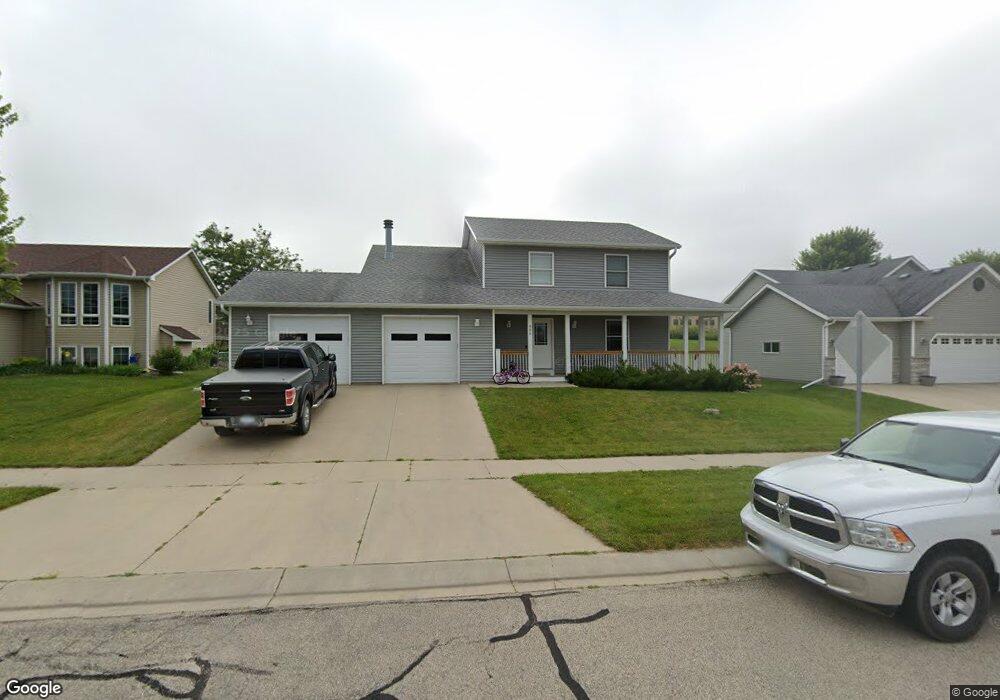
This home is located at 606 7th Ave NE, Byron, MN 55920 and is currently estimated at $447,074, approximately $153 per square foot. 606 7th Ave NE is a home located in Olmsted County with nearby schools including Byron Intermediate School, Byron Middle School, and Byron Senior High School.
Ownership History
Date
Name
Owned For
Owner Type
Purchase Details
Closed on
Oct 6, 2017
Sold by
Eustice Brent
Bought by
Kalscheur Daniel N and Kalscheur Emilia
Current Estimated Value
Home Financials for this Owner
Home Financials are based on the most recent Mortgage that was taken out on this home.
Original Mortgage
$256,400
Outstanding Balance
$214,166
Interest Rate
3.82%
Mortgage Type
New Conventional
Estimated Equity
$232,908
Purchase Details
Closed on
Mar 30, 2011
Sold by
Hsbc Bank Usa National Association
Bought by
Eustice Brent
Home Financials for this Owner
Home Financials are based on the most recent Mortgage that was taken out on this home.
Original Mortgage
$163,012
Interest Rate
4.88%
Mortgage Type
New Conventional
Purchase Details
Closed on
Apr 7, 2010
Sold by
Harden Monte D and Harden Shelly A
Bought by
Hsbc Bank Usa National Association
Create a Home Valuation Report for This Property
The Home Valuation Report is an in-depth analysis detailing your home's value as well as a comparison with similar homes in the area
Home Values in the Area
Average Home Value in this Area
Purchase History
| Date | Buyer | Sale Price | Title Company |
|---|---|---|---|
| Kalscheur Daniel N | $26,990 | Rochester Title & Escrow Co | |
| Eustice Brent | $150,000 | Mn Abstract & Title Co | |
| Hsbc Bank Usa National Association | $208,169 | None Available |
Source: Public Records
Mortgage History
| Date | Status | Borrower | Loan Amount |
|---|---|---|---|
| Open | Kalscheur Daniel N | $256,400 | |
| Previous Owner | Eustice Brent | $163,012 |
Source: Public Records
Tax History Compared to Growth
Tax History
| Year | Tax Paid | Tax Assessment Tax Assessment Total Assessment is a certain percentage of the fair market value that is determined by local assessors to be the total taxable value of land and additions on the property. | Land | Improvement |
|---|---|---|---|---|
| 2024 | $5,752 | $367,900 | $45,000 | $322,900 |
| 2023 | $5,708 | $365,000 | $45,000 | $320,000 |
| 2022 | $5,234 | $356,400 | $45,000 | $311,400 |
| 2021 | $4,686 | $295,000 | $45,000 | $250,000 |
| 2020 | $4,518 | $282,700 | $45,000 | $237,700 |
| 2019 | $4,310 | $267,300 | $40,000 | $227,300 |
| 2018 | $3,699 | $257,000 | $35,000 | $222,000 |
| 2017 | $3,528 | $230,300 | $35,000 | $195,300 |
| 2016 | $3,170 | $199,200 | $32,100 | $167,100 |
| 2015 | $3,072 | $174,400 | $31,400 | $143,000 |
| 2014 | $2,840 | $175,500 | $31,500 | $144,000 |
| 2012 | -- | $174,500 | $31,433 | $143,067 |
Source: Public Records
Map
Nearby Homes
- xxx 4th St NE
- 1826 (L15,B2) 4th St NE
- 1720 (L1,B2) 4th St NE
- 1890 (L19,B2) 4th St NE
- 1756 (L4,B2) 4th St NE
- TBD 708th St
- 700 Shardlow Place NE
- 702 Shardlow Place NE
- 655 Somerby Pkwy NE
- 667 Somerby Pkwy NE
- 1004 Southwell Enclave NE
- 675 Somerby Pkwy NE
- 1005 4th Ave NE
- 1052 Southwell Enclave NE
- 959 Southwell Enclave NE
- 1064 Southwell Enclave NE
- 720 Somerby Pkwy NE
- 1021 Southwell Enclave NE
- 963 Southwell Enclave NE
- 1033 Southwell Enclave NE
- 514 7th Ave NE
- 610 7th Ave NE
- 514 514 7th-Avenue-ne
- 510 7th Ave NE
- 614 7th Ave NE
- 607 7th Ave NE
- 506 7th Ave NE
- 618 618 7th-Avenue-ne
- 618 7th Ave NE
- 611 7th Ave NE
- 509 7th Ave NE
- 605 6th St NE
- 615 615 7th-Avenue-ne
- 615 7th Ave NE
- 502 7th Ave NE
- 505 7th Ave NE
- 619 7th Ave NE
- 601 6th St NE
- 410 7th Ave NE
- 410 410 7th-Avenue-ne