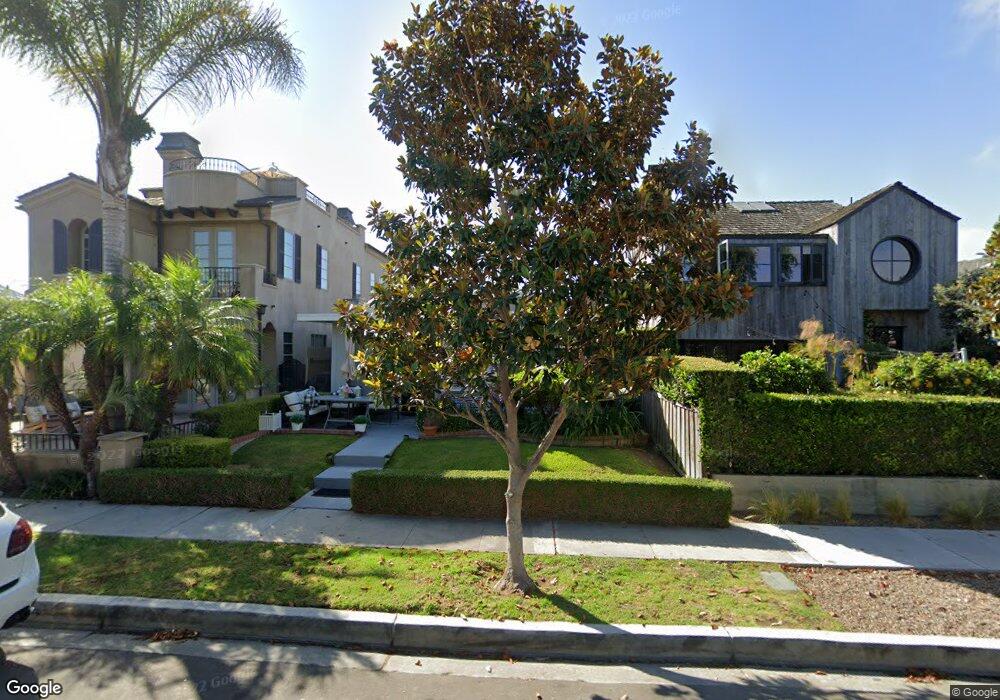
606 Begonia Ave Unit 1/2 Corona Del Mar, CA 92625
Corona Del Mar NeighborhoodEstimated Value: $3,214,727 - $3,468,000
1
Bed
1
Bath
1,341
Sq Ft
$2,483/Sq Ft
Est. Value
About This Home
This home is located at 606 Begonia Ave Unit 1/2, Corona Del Mar, CA 92625 and is currently estimated at $3,329,682, approximately $2,482 per square foot. 606 Begonia Ave Unit 1/2 is a home located in Orange County with nearby schools including Harbor View Elementary School, Corona del Mar Middle and High School, and Del Mar Lincoln Child Development Center.
Ownership History
Date
Name
Owned For
Owner Type
Purchase Details
Closed on
Jun 27, 2025
Sold by
2024 Mckay Family Trust and Swanson Family Trust
Bought by
Kewamee Drive Llc
Current Estimated Value
Purchase Details
Closed on
May 23, 2024
Sold by
Mckay Family Trust and Mckay Sandra R
Bought by
2024 Mckay Family Trust and Mckay
Purchase Details
Closed on
Jun 30, 2016
Sold by
Swanson Jake Cameron and Swanson Jake C
Bought by
Swanson Jake C and Swanson Johanna A
Purchase Details
Closed on
Jun 20, 2012
Sold by
Williams Kathryn
Bought by
Swanson Jed Williams and Swanson Jake Cameron
Purchase Details
Closed on
Jun 29, 2011
Sold by
Swanson Donald G
Bought by
Swanson Donald G
Purchase Details
Closed on
Aug 31, 2004
Sold by
Swanson Donald G
Bought by
Swanson Donald G
Create a Home Valuation Report for This Property
The Home Valuation Report is an in-depth analysis detailing your home's value as well as a comparison with similar homes in the area
Home Values in the Area
Average Home Value in this Area
Purchase History
| Date | Buyer | Sale Price | Title Company |
|---|---|---|---|
| Kewamee Drive Llc | $3,300,000 | Chicago Title Company | |
| 2024 Mckay Family Trust | -- | None Listed On Document | |
| Swanson Jake C | -- | None Available | |
| Swanson Jed Williams | -- | None Available | |
| Swanson Donald G | -- | None Available | |
| Swanson Donald G | -- | -- |
Source: Public Records
Tax History Compared to Growth
Tax History
| Year | Tax Paid | Tax Assessment Tax Assessment Total Assessment is a certain percentage of the fair market value that is determined by local assessors to be the total taxable value of land and additions on the property. | Land | Improvement |
|---|---|---|---|---|
| 2025 | $2,951 | $119,729 | $70,573 | $49,156 |
| 2024 | $2,951 | $117,382 | $69,189 | $48,193 |
| 2023 | $2,884 | $115,081 | $67,832 | $47,249 |
| 2022 | $2,860 | $112,825 | $66,502 | $46,323 |
| 2021 | $2,818 | $110,613 | $65,198 | $45,415 |
| 2020 | $2,786 | $109,479 | $64,529 | $44,950 |
| 2019 | $2,784 | $107,333 | $63,264 | $44,069 |
| 2018 | $2,858 | $105,229 | $62,024 | $43,205 |
| 2017 | $1,570 | $103,166 | $60,808 | $42,358 |
| 2016 | $1,540 | $101,144 | $59,616 | $41,528 |
| 2015 | $1,522 | $99,625 | $58,720 | $40,905 |
| 2014 | $1,488 | $97,674 | $57,570 | $40,104 |
Source: Public Records
Map
Nearby Homes
- 604 Begonia Ave
- 509 Carnation Ave
- 506 Avocado Ave
- 429 Dahlia Ave
- 737 Avocado Ave Unit 106
- 435 Fernleaf Ave Unit 1
- 516 1/2 Larkspur (Rear Home) Ave
- 2548 Bungalow Place Unit 84
- 508 Goldenrod Ave
- 2200 Pacific Dr
- 2616 Bungalow Place Unit 59
- 2516 Bayside Dr
- 407 1/2 Goldenrod Ave
- 708 Heliotrope Ave
- 302 Carnation Ave
- 1007 White Sails Way
- 618 Iris Ave Unit B
- 2501 Seaview Ave
- 412 Heliotrope Ave
- 516 Iris Ave
- 608 Begonia Ave Unit B
- 608 Begonia Ave
- 608 1/2 Begonia Ave Unit B
- 608 1/2 Begonia Ave
- 610 Begonia Ave
- 602 Begonia Ave
- 600 Begonia Ave
- 612 Begonia Ave
- 614 Begonia Ave
- 607 Carnation Ave
- 609 Carnation Ave
- 605 Carnation Ave
- 609 5 Begonia Ave
- 611 5 Begonia Ave
- 611 Carnation Ave
- 603 Carnation Ave Unit 1
- 603 Carnation Ave Unit 2
- 603 Carnation Ave Unit 1/2
- 603 Carnation Ave
- 616 Begonia Ave