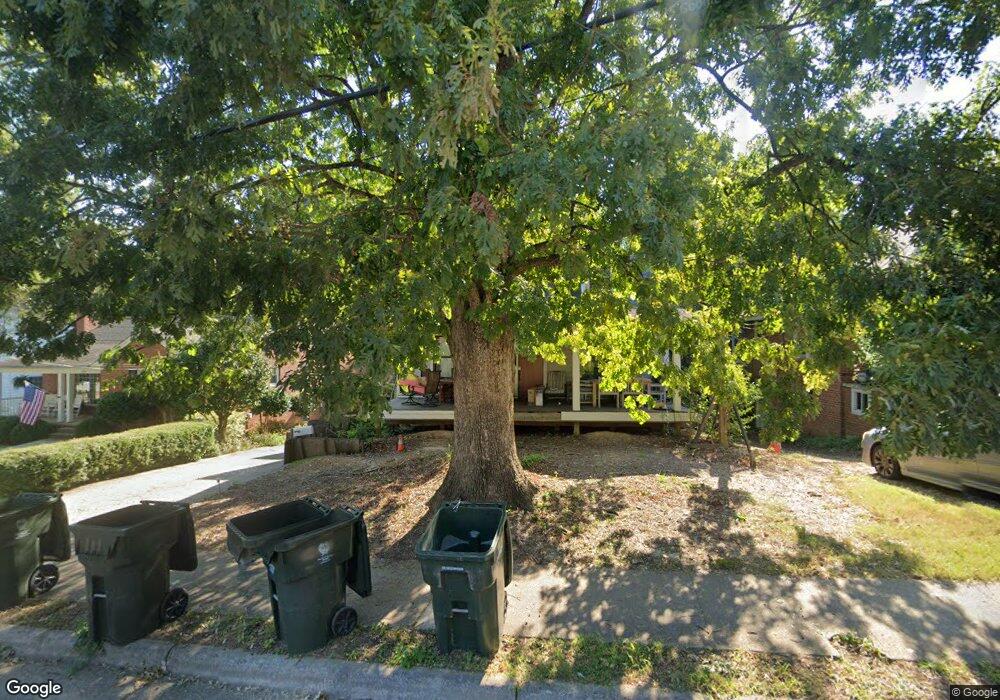
606 Dixie Trail Unit 1/2 Raleigh, NC 27607
University Park NeighborhoodEstimated Value: $637,000 - $736,863
2
Beds
1
Bath
700
Sq Ft
$989/Sq Ft
Est. Value
About This Home
This home is located at 606 Dixie Trail Unit 1/2, Raleigh, NC 27607 and is currently estimated at $692,216, approximately $988 per square foot. 606 Dixie Trail Unit 1/2 is a home located in Wake County with nearby schools including Olds Elementary School, Leroy Martin Magnet, and Broughton Magnet High School.
Ownership History
Date
Name
Owned For
Owner Type
Purchase Details
Closed on
Oct 21, 2014
Sold by
Smith Stephen M and Meyer Shelley A
Bought by
Mertes Timothy R
Current Estimated Value
Home Financials for this Owner
Home Financials are based on the most recent Mortgage that was taken out on this home.
Original Mortgage
$220,000
Outstanding Balance
$168,972
Interest Rate
4.15%
Mortgage Type
New Conventional
Estimated Equity
$523,244
Purchase Details
Closed on
Sep 3, 2013
Sold by
Smith Stephen M and Meyer Shelly
Bought by
Smith Stephen M and Meyer Shelley
Home Financials for this Owner
Home Financials are based on the most recent Mortgage that was taken out on this home.
Original Mortgage
$230,700
Interest Rate
4.37%
Mortgage Type
New Conventional
Purchase Details
Closed on
Jul 31, 1998
Sold by
Upchurch John Lee
Bought by
Smith Stephen M
Create a Home Valuation Report for This Property
The Home Valuation Report is an in-depth analysis detailing your home's value as well as a comparison with similar homes in the area
Home Values in the Area
Average Home Value in this Area
Purchase History
| Date | Buyer | Sale Price | Title Company |
|---|---|---|---|
| Mertes Timothy R | $260,000 | Investors Title Insurance Co | |
| Smith Stephen M | -- | None Available | |
| Smith Stephen M | $155,500 | -- |
Source: Public Records
Mortgage History
| Date | Status | Borrower | Loan Amount |
|---|---|---|---|
| Open | Mertes Timothy R | $220,000 | |
| Previous Owner | Smith Stephen M | $230,700 |
Source: Public Records
Tax History
| Year | Tax Paid | Tax Assessment Tax Assessment Total Assessment is a certain percentage of the fair market value that is determined by local assessors to be the total taxable value of land and additions on the property. | Land | Improvement |
|---|---|---|---|---|
| 2025 | $5,656 | $643,913 | $450,000 | $193,913 |
| 2024 | $5,632 | $643,913 | $450,000 | $193,913 |
| 2023 | $3,851 | $349,609 | $240,000 | $109,609 |
| 2022 | $3,580 | $349,609 | $240,000 | $109,609 |
| 2021 | $3,442 | $349,609 | $240,000 | $109,609 |
| 2020 | $3,379 | $349,609 | $240,000 | $109,609 |
| 2019 | $3,011 | $256,373 | $160,000 | $96,373 |
| 2018 | $2,841 | $256,373 | $160,000 | $96,373 |
| 2017 | $2,847 | $269,867 | $160,000 | $109,867 |
| 2016 | $2,732 | $264,220 | $160,000 | $104,220 |
| 2015 | $2,658 | $252,865 | $162,500 | $90,365 |
| 2014 | $2,523 | $252,865 | $162,500 | $90,365 |
Source: Public Records
Map
Nearby Homes
- 811 Maple Berry Ln Unit 103
- 811 Maple Berry Ln Unit 105
- 810 Maple Berry Ln Unit 106
- 810 Maple Berry Ln Unit 105
- 810 Maple Berry Ln Unit 104
- 912 Dixie Trail
- 712 Beaver Dam Rd
- 3304 Wade Ave
- 403 Brooks Ave
- 908 Brookwood Dr
- 3113 Clark Ave
- 1003 Canterbury Rd
- 3100 Raymond St
- 1000 Canterbury Rd
- 1225 Dixie Trail
- 1221 Dixie Trail
- 212 Brooks Ave
- 1309 Brooks Ave
- 1303 Nottingham Rd
- 1332 Banbury Rd
- 606 Dixie Trail
- 608 Dixie Trail
- 604 Dixie Trail
- 2834 Mayview Rd
- 602 Dixie Trail
- 610 Dixie Trail
- 2830 Mayview Rd
- 2839 Barmettler St
- 612 Dixie Trail
- 2828 Mayview Rd
- 522 Dixie Trail
- 613 Dixie Trail
- 605 Dixie Trail
- 603 Dixie Trail
- 2835 Barmettler St
- 601 Dixie Trail
- 617 Dixie Trail
- 2833 Barmettler St
- 2833 Barmettler St Unit 2833 Barmettler
- 2826 Mayview Rd