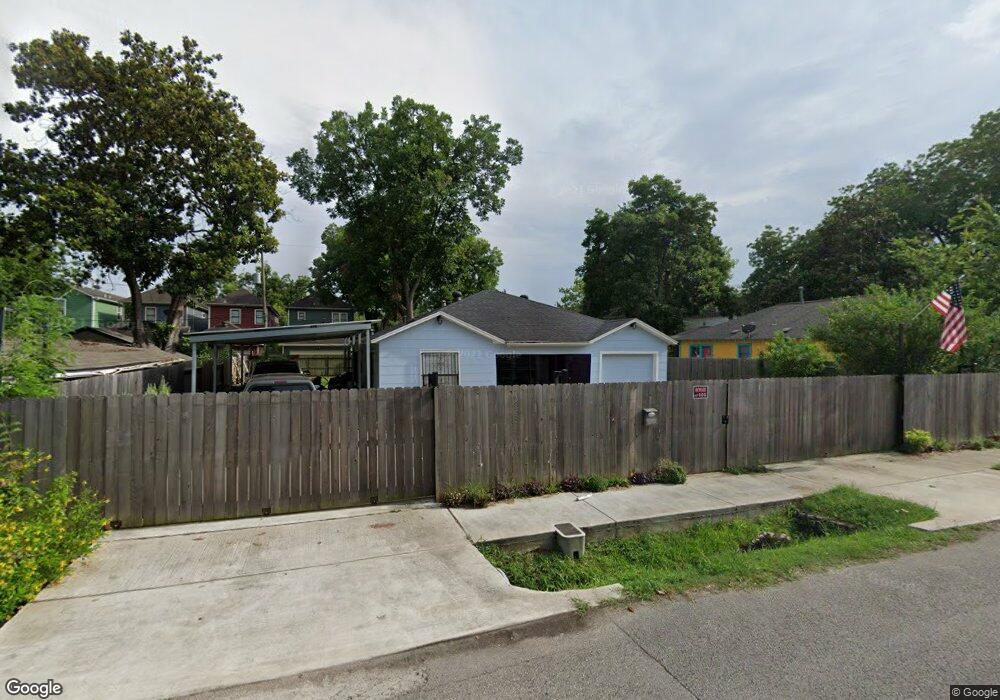
606 E 28th St Houston, TX 77008
Greater Heights NeighborhoodEstimated Value: $591,000 - $742,214
2
Beds
1
Bath
882
Sq Ft
$749/Sq Ft
Est. Value
About This Home
This home is located at 606 E 28th St, Houston, TX 77008 and is currently estimated at $661,054, approximately $749 per square foot. 606 E 28th St is a home located in Harris County with nearby schools including Field Elementary School, Hamilton Middle, and Heights High School.
Ownership History
Date
Name
Owned For
Owner Type
Purchase Details
Closed on
May 14, 2012
Sold by
Shelds Georgia Ann and Cuccerre George
Bought by
Quiroga Jose M and Franco Caryn C S
Current Estimated Value
Home Financials for this Owner
Home Financials are based on the most recent Mortgage that was taken out on this home.
Original Mortgage
$148,000
Outstanding Balance
$103,117
Interest Rate
4.02%
Mortgage Type
New Conventional
Estimated Equity
$557,937
Create a Home Valuation Report for This Property
The Home Valuation Report is an in-depth analysis detailing your home's value as well as a comparison with similar homes in the area
Home Values in the Area
Average Home Value in this Area
Purchase History
| Date | Buyer | Sale Price | Title Company |
|---|---|---|---|
| Quiroga Jose M | -- | None Available |
Source: Public Records
Mortgage History
| Date | Status | Borrower | Loan Amount |
|---|---|---|---|
| Open | Quiroga Jose M | $148,000 |
Source: Public Records
Tax History
| Year | Tax Paid | Tax Assessment Tax Assessment Total Assessment is a certain percentage of the fair market value that is determined by local assessors to be the total taxable value of land and additions on the property. | Land | Improvement |
|---|---|---|---|---|
| 2025 | $7,982 | $800,159 | $765,000 | $35,159 |
| 2024 | $7,982 | $724,200 | $675,000 | $49,200 |
| 2023 | $7,982 | $681,282 | $630,000 | $51,282 |
| 2022 | $9,605 | $560,068 | $522,000 | $38,068 |
| 2021 | $9,243 | $508,728 | $495,000 | $13,728 |
| 2020 | $8,730 | $503,882 | $495,000 | $8,882 |
| 2019 | $8,293 | $523,481 | $495,000 | $28,481 |
| 2018 | $5,760 | $494,107 | $468,000 | $26,107 |
| 2017 | $6,849 | $494,107 | $468,000 | $26,107 |
| 2016 | $6,226 | $416,107 | $390,000 | $26,107 |
| 2015 | $4,027 | $364,187 | $337,500 | $26,687 |
| 2014 | $4,027 | $285,000 | $270,000 | $15,000 |
Source: Public Records
Map
Nearby Homes
- 618 E 28th St
- 519 E 28th St
- 608 E 26th St
- 707 E 28th St
- 407 E 27th St
- 404 E 28th St
- 2608 Arlington St
- 2804 Arlington St
- 711 E 26th St
- 319 E 26th St
- 0 N Loop E Unit 18907695
- 310 E 28th St
- 308 E 28th St
- 726 E 26th St
- 00 E 31st St
- 508 E 25th St
- 727 E 25th St
- 806 E 29th St
- 2415 Columbia St
- 716 E 25th St
Your Personal Tour Guide
Ask me questions while you tour the home.