Estimated Value: $616,000 - $734,000
5
Beds
3
Baths
1,633
Sq Ft
$405/Sq Ft
Est. Value
About This Home
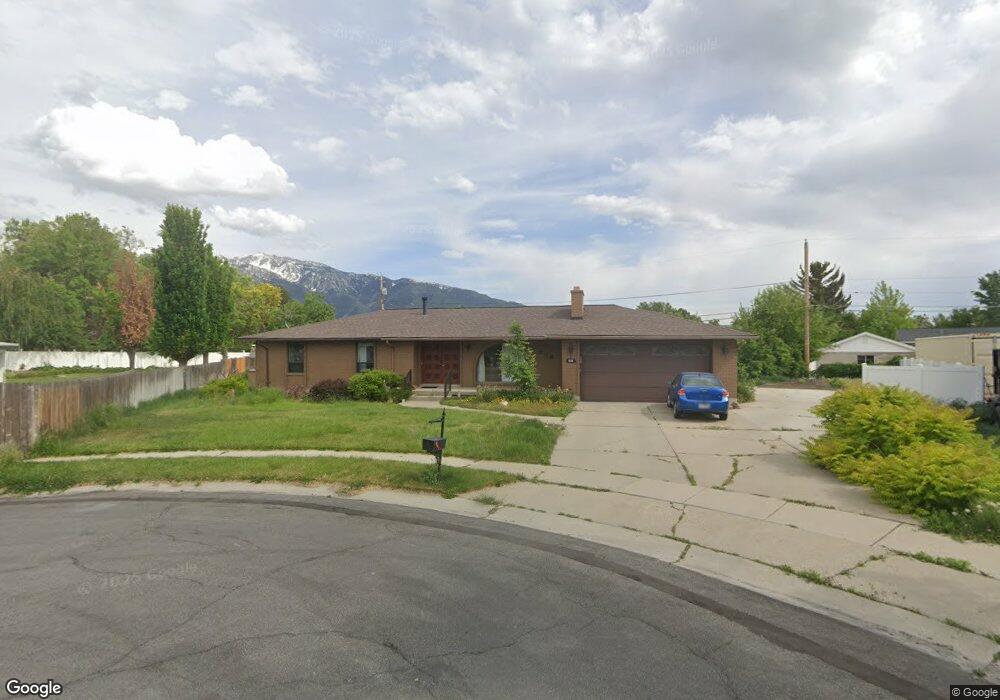
This home is located at 606 Faye Cir, Sandy, UT 84070 and is currently estimated at $661,418, approximately $405 per square foot. 606 Faye Cir is a home located in Salt Lake County with nearby schools including Mount Jordan Middle School, Jordan High, and The Waterford School.
Ownership History
Date
Name
Owned For
Owner Type
Purchase Details
Closed on
Dec 21, 2022
Sold by
Maxwell Byron S
Bought by
Fisher Isaac and Fisher Margo Pfeifer
Current Estimated Value
Home Financials for this Owner
Home Financials are based on the most recent Mortgage that was taken out on this home.
Original Mortgage
$521,550
Outstanding Balance
$503,972
Interest Rate
6.31%
Estimated Equity
$157,446
Purchase Details
Closed on
Aug 14, 2009
Sold by
Maxwell Byron S and Maxwell Verlyn G
Bought by
Maxwell Byron S and Maxwell Verlyn G
Create a Home Valuation Report for This Property
The Home Valuation Report is an in-depth analysis detailing your home's value as well as a comparison with similar homes in the area
Home Values in the Area
Average Home Value in this Area
Purchase History
| Date | Buyer | Sale Price | Title Company |
|---|---|---|---|
| Fisher Isaac | -- | -- | |
| Maxwell Byron S | -- | None Available |
Source: Public Records
Mortgage History
| Date | Status | Borrower | Loan Amount |
|---|---|---|---|
| Open | Fisher Isaac | $521,550 |
Source: Public Records
Tax History Compared to Growth
Tax History
| Year | Tax Paid | Tax Assessment Tax Assessment Total Assessment is a certain percentage of the fair market value that is determined by local assessors to be the total taxable value of land and additions on the property. | Land | Improvement |
|---|---|---|---|---|
| 2025 | $3,095 | $642,100 | $227,100 | $415,000 |
| 2024 | $3,095 | $572,400 | $220,900 | $351,500 |
| 2023 | $2,894 | $533,700 | $201,400 | $332,300 |
| 2022 | $2,993 | $539,100 | $129,800 | $409,300 |
| 2021 | $2,692 | $412,800 | $99,600 | $313,200 |
| 2020 | $2,566 | $371,000 | $99,600 | $271,400 |
| 2019 | $2,425 | $341,700 | $94,000 | $247,700 |
| 2018 | $2,086 | $306,000 | $94,000 | $212,000 |
| 2017 | $2,055 | $288,100 | $94,000 | $194,100 |
| 2016 | $2,095 | $283,900 | $94,000 | $189,900 |
| 2015 | $2,078 | $260,500 | $91,200 | $169,300 |
| 2014 | $2,024 | $248,700 | $88,400 | $160,300 |
Source: Public Records
Map
Nearby Homes
- 662 E Floyd Dr
- 665 E Howard Dr
- 9593 S 700 E
- 7433 S 410 E
- 7425 S 410 E
- 9324 Brighton View Dr
- 9835 S 610 E
- 9787 S David St
- 9499 S 220 E
- 9920 S Darin Dr
- 203 Kristin Dr
- 783 E Newfield Dr Unit 146
- 199 E Lynn Cir
- 425 E Mountain View Dr
- 9439 S Meckailee Cove
- 9534 S Poppy Ln
- 184 E Corrie Cir
- 915 E Galena Dr
- 274 Park Knoll Cir
- 9203 S 220 E