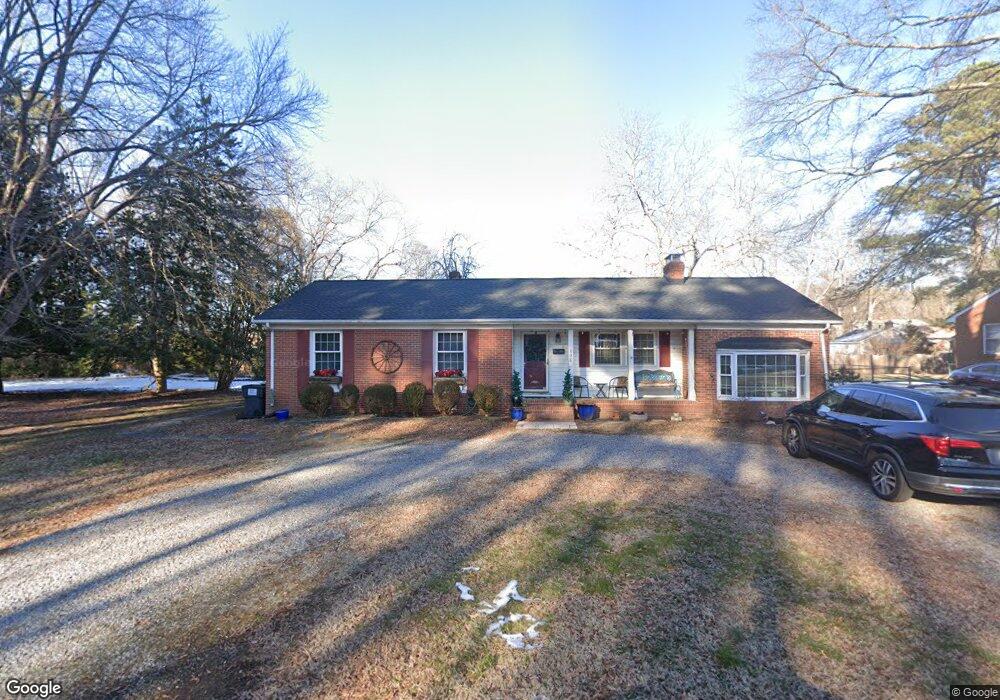
606 John St Ashland, VA 23005
Estimated Value: $348,518 - $381,000
3
Beds
2
Baths
1,494
Sq Ft
$240/Sq Ft
Est. Value
About This Home
This home is located at 606 John St, Ashland, VA 23005 and is currently estimated at $358,880, approximately $240 per square foot. 606 John St is a home located in Hanover County with nearby schools including Henry Clay Elementary School, Liberty Middle School, and Patrick Henry High School.
Ownership History
Date
Name
Owned For
Owner Type
Purchase Details
Closed on
Apr 18, 2022
Sold by
Skr Properties Llc
Bought by
Welsh Douglas and Welsh Whitney
Current Estimated Value
Home Financials for this Owner
Home Financials are based on the most recent Mortgage that was taken out on this home.
Original Mortgage
$208,000
Outstanding Balance
$195,193
Interest Rate
4.16%
Mortgage Type
New Conventional
Estimated Equity
$163,687
Purchase Details
Closed on
Oct 16, 2006
Sold by
Barnett William S
Bought by
Robertson Michael K
Create a Home Valuation Report for This Property
The Home Valuation Report is an in-depth analysis detailing your home's value as well as a comparison with similar homes in the area
Home Values in the Area
Average Home Value in this Area
Purchase History
| Date | Buyer | Sale Price | Title Company |
|---|---|---|---|
| Welsh Douglas | $260,000 | Earley Laura J | |
| Welsh Douglas | -- | None Listed On Document | |
| Robertson Michael K | $20,000 | -- |
Source: Public Records
Mortgage History
| Date | Status | Borrower | Loan Amount |
|---|---|---|---|
| Open | Welsh Douglas | $208,000 | |
| Closed | Welsh Douglas | $208,000 |
Source: Public Records
Tax History
| Year | Tax Paid | Tax Assessment Tax Assessment Total Assessment is a certain percentage of the fair market value that is determined by local assessors to be the total taxable value of land and additions on the property. | Land | Improvement |
|---|---|---|---|---|
| 2025 | $2,552 | $315,000 | $100,500 | $214,500 |
| 2024 | $2,552 | $315,000 | $100,500 | $214,500 |
| 2023 | $2,121 | $275,400 | $90,500 | $184,900 |
| 2022 | $2,002 | $247,200 | $80,500 | $166,700 |
| 2021 | $1,951 | $240,900 | $80,500 | $160,400 |
| 2020 | $1,860 | $229,600 | $80,500 | $149,100 |
| 2019 | $1,638 | $202,200 | $65,500 | $136,700 |
| 2018 | $1,638 | $202,200 | $65,500 | $136,700 |
| 2017 | $1,399 | $172,700 | $56,000 | $116,700 |
| 2016 | $1,399 | $172,700 | $56,000 | $116,700 |
| 2015 | $1,391 | $171,700 | $55,000 | $116,700 |
| 2014 | $1,391 | $171,700 | $55,000 | $116,700 |
Source: Public Records
Map
Nearby Homes
- 118 Lauradell Rd
- 0 N Snead St
- 303 N Snead St
- 204 Lauradell Rd
- 109 Axton Ln
- 720 Chapman St
- 124 Axton Ln
- Lot 73 Lauradell Rd
- 505 N James St
- 568 N James St
- 104 Linden St
- 307 S Railroad Ave
- 709 Virginia St
- 608 Old Station St
- 126 Arlington Square
- 213 Berkley St
- 14106 Falcon Crest Ct
- 13976 Hungryjack Ct
- 6 Courtside Ln
- 11228 Hill Ridge Ct