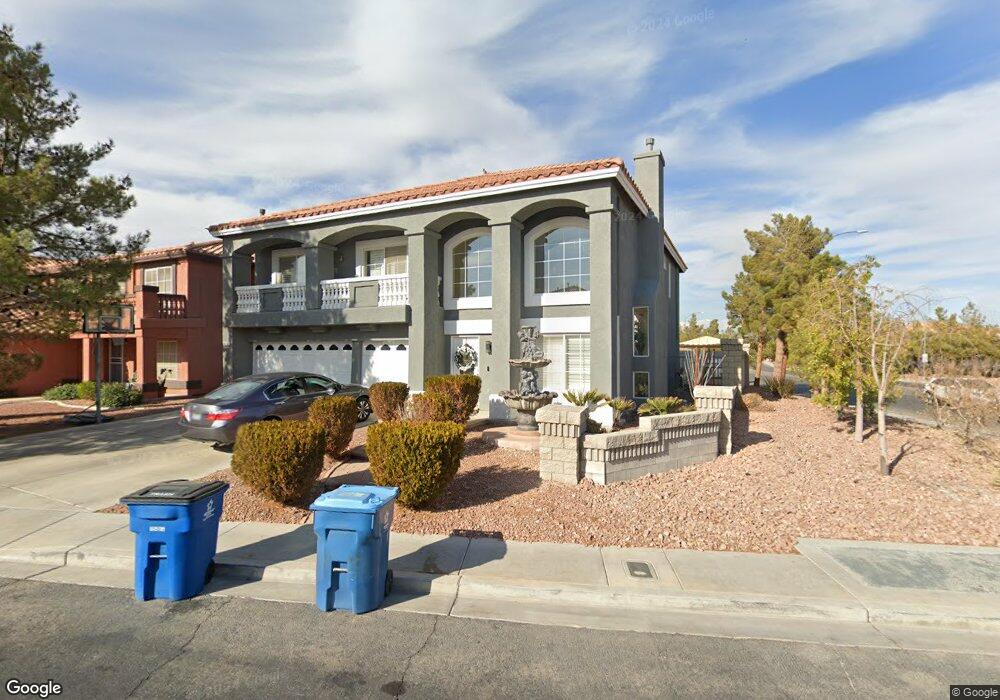
606 Leap Frog Ave Las Vegas, NV 89183
Silverado Ranch NeighborhoodEstimated Value: $637,000 - $665,000
5
Beds
3
Baths
3,136
Sq Ft
$208/Sq Ft
Est. Value
About This Home
This home is located at 606 Leap Frog Ave, Las Vegas, NV 89183 and is currently estimated at $651,838, approximately $207 per square foot. 606 Leap Frog Ave is a home located in Clark County with nearby schools including John C. Bass Elementary School, Charles Silvestri Junior High School, and Liberty High School.
Ownership History
Date
Name
Owned For
Owner Type
Purchase Details
Closed on
May 23, 2022
Sold by
Viloria and Magelin
Bought by
Magelin Cacho Viloria And Benjamin Tagata Vil
Current Estimated Value
Purchase Details
Closed on
Dec 13, 2007
Sold by
Viloria Magelin
Bought by
Viloria Benjamin and Viloria Magelin
Purchase Details
Closed on
Jan 7, 2005
Sold by
Viloria Benjamin and Viloria Magelin
Bought by
Viloria Magelin
Home Financials for this Owner
Home Financials are based on the most recent Mortgage that was taken out on this home.
Original Mortgage
$366,000
Interest Rate
5.33%
Mortgage Type
Negative Amortization
Purchase Details
Closed on
Aug 19, 2002
Sold by
American West Homes Inc
Bought by
Viloria Benjamin and Viloria Magelin
Home Financials for this Owner
Home Financials are based on the most recent Mortgage that was taken out on this home.
Original Mortgage
$217,233
Interest Rate
6.43%
Create a Home Valuation Report for This Property
The Home Valuation Report is an in-depth analysis detailing your home's value as well as a comparison with similar homes in the area
Home Values in the Area
Average Home Value in this Area
Purchase History
| Date | Buyer | Sale Price | Title Company |
|---|---|---|---|
| Magelin Cacho Viloria And Benjamin Tagata Vil | -- | None Listed On Document | |
| Viloria Benjamin | -- | None Available | |
| Viloria Magelin | -- | North American Title Co | |
| Viloria Benjamin | $240,350 | First American Title Co |
Source: Public Records
Mortgage History
| Date | Status | Borrower | Loan Amount |
|---|---|---|---|
| Previous Owner | Viloria Magelin | $366,000 | |
| Previous Owner | Viloria Benjamin | $217,233 |
Source: Public Records
Tax History Compared to Growth
Tax History
| Year | Tax Paid | Tax Assessment Tax Assessment Total Assessment is a certain percentage of the fair market value that is determined by local assessors to be the total taxable value of land and additions on the property. | Land | Improvement |
|---|---|---|---|---|
| 2025 | $3,138 | $181,313 | $54,950 | $126,363 |
| 2024 | $3,047 | $181,313 | $54,950 | $126,363 |
| 2023 | $3,047 | $167,668 | $48,300 | $119,368 |
| 2022 | $2,959 | $145,622 | $36,750 | $108,872 |
| 2021 | $2,872 | $138,239 | $34,650 | $103,589 |
| 2020 | $2,886 | $135,068 | $32,550 | $102,518 |
| 2019 | $2,705 | $130,262 | $29,400 | $100,862 |
| 2018 | $2,581 | $120,993 | $24,500 | $96,493 |
| 2017 | $3,242 | $110,539 | $23,450 | $87,089 |
| 2016 | $2,416 | $99,045 | $17,850 | $81,195 |
| 2015 | $2,411 | $84,529 | $16,100 | $68,429 |
| 2014 | $2,336 | $77,280 | $10,500 | $66,780 |
Source: Public Records
Map
Nearby Homes
- 577 Leap Frog Ave
- 554 Campus Oaks Ct
- 527 Leap Frog Ave
- 484 Fiddlehead Ave
- 681 Stone Hammer Ave
- 10680 Spruce Bough St
- 10802 Serendipity Ct
- 10479 Baby Bud St
- 10590 Medicine Bow St
- 647 Great River Ave
- 10656 Timber Stand St
- 645 Soaring Wings Ave
- 10658 Chillingham Dr
- 10414 Midseason Mist St
- 628 Soaring Wings Ave
- 10675 Chillingham Dr
- 10568 Salmon Leap St
- 3756 Toscanella Ave
- 10374 Baby Bud St
- 855 Beartooth Falls Ct
- 596 Leap Frog Ave
- 595 Campus Oaks Ct
- 586 Leap Frog Ave
- 585 Campus Oaks Ct
- 607 Leap Frog Ave
- 597 Leap Frog Ave
- 576 Leap Frog Ave
- 576 Leap Frog Ave
- 575 Campus Oaks Ct
- 10697 Wildhurst St
- 587 Leap Frog Ave
- 10689 Wildhurst St
- 10711 Wildhurst St
- 566 Leap Frog Ave
- 565 Campus Oaks Ct
- 594 Campus Oaks Ct
- 594 Campus Oaks Ct Unit na
- 594 Campus Oaks Ct Unit none
- 10719 Wildhurst St
- 612 Fiddlehead Ave