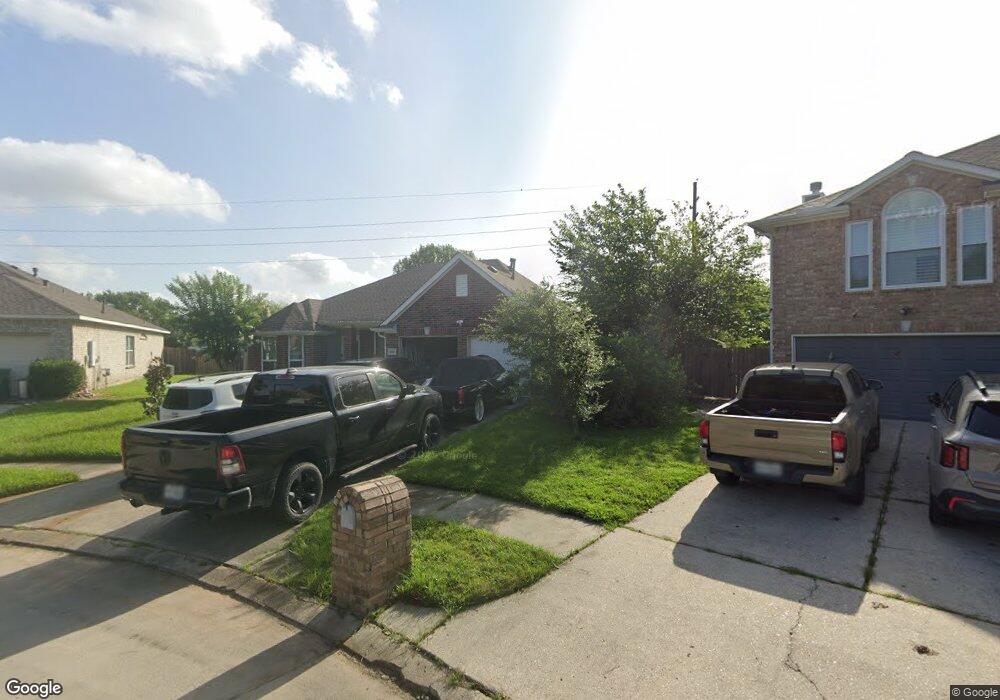
606 Loggers Chase Ct Spring, TX 77386
Estimated Value: $296,000 - $311,000
3
Beds
3
Baths
1,918
Sq Ft
$157/Sq Ft
Est. Value
About This Home
This home is located at 606 Loggers Chase Ct, Spring, TX 77386 and is currently estimated at $301,662, approximately $157 per square foot. 606 Loggers Chase Ct is a home located in Montgomery County with nearby schools including Oak Ridge Elementary School, Vogel Intermediate School, and Irons J High School.
Ownership History
Date
Name
Owned For
Owner Type
Purchase Details
Closed on
Dec 28, 2016
Sold by
Murray Equity Llc
Bought by
Ramirez Mark and Ramirez Sandra
Current Estimated Value
Home Financials for this Owner
Home Financials are based on the most recent Mortgage that was taken out on this home.
Original Mortgage
$185,940
Outstanding Balance
$152,438
Interest Rate
3.94%
Mortgage Type
VA
Estimated Equity
$149,224
Purchase Details
Closed on
Jul 5, 2016
Sold by
Midfirst Bank
Bought by
Murray Equity Llc
Purchase Details
Closed on
Apr 21, 2016
Sold by
Mcgowen Hermadine Ann
Bought by
Ramirez Mark and Ramirez Sandra
Purchase Details
Closed on
Nov 8, 2007
Sold by
Mcgowen Ellis O
Bought by
Mcgowen Hermadine
Purchase Details
Closed on
Oct 2, 2001
Sold by
Mcgowen Hermadine Ann and Mcgowen Ellis O
Bought by
National City Mtg Co
Purchase Details
Closed on
Jan 13, 2000
Sold by
Deerwood Homes Inc
Bought by
Mcgowen Hermadine Ann
Home Financials for this Owner
Home Financials are based on the most recent Mortgage that was taken out on this home.
Original Mortgage
$113,932
Interest Rate
7.86%
Mortgage Type
FHA
Create a Home Valuation Report for This Property
The Home Valuation Report is an in-depth analysis detailing your home's value as well as a comparison with similar homes in the area
Home Values in the Area
Average Home Value in this Area
Purchase History
| Date | Buyer | Sale Price | Title Company |
|---|---|---|---|
| Ramirez Mark | -- | Great American Title Company | |
| Murray Equity Llc | -- | None Available | |
| Ramirez Mark | -- | -- | |
| Mcgowen Hermadine | -- | None Available | |
| National City Mtg Co | $120,030 | -- | |
| Mcgowen Hermadine Ann | -- | American Title Co |
Source: Public Records
Mortgage History
| Date | Status | Borrower | Loan Amount |
|---|---|---|---|
| Open | Ramirez Mark | $185,940 | |
| Previous Owner | Mcgowen Hermadine Ann | $113,932 |
Source: Public Records
Tax History Compared to Growth
Tax History
| Year | Tax Paid | Tax Assessment Tax Assessment Total Assessment is a certain percentage of the fair market value that is determined by local assessors to be the total taxable value of land and additions on the property. | Land | Improvement |
|---|---|---|---|---|
| 2025 | $2,655 | $298,196 | $58,000 | $240,196 |
| 2024 | $5,382 | $291,943 | $58,000 | $233,943 |
| 2023 | $5,382 | $291,130 | $58,000 | $233,130 |
| 2022 | $5,235 | $259,010 | $58,000 | $201,010 |
| 2021 | $4,480 | $208,480 | $11,000 | $197,480 |
| 2020 | $4,330 | $192,930 | $11,000 | $181,930 |
| 2019 | $4,149 | $190,810 | $11,000 | $179,810 |
| 2018 | $4,088 | $176,620 | $11,000 | $165,620 |
| 2017 | $4,146 | $176,620 | $11,000 | $165,620 |
| 2016 | $3,591 | $152,950 | $11,000 | $141,950 |
| 2015 | $3,110 | $152,050 | $11,000 | $148,850 |
| 2014 | $3,110 | $138,230 | $11,000 | $127,230 |
Source: Public Records
Map
Nearby Homes
- 25619 Oakridge Forest Ln
- 25807 Oakridge Forest Ln
- 25819 Oakridge Forest Ln
- 519 Joshua Lee Ln
- 323 Spring Woods Dr
- 427 Pinewood Ridge Dr
- 25535 Richards Rd
- 1010 Forestburg Dr
- 25802 Maplewood Dr
- 25142 Andris Ln
- 26003 Woodglen Dr
- 25131 Alina Ln
- 25206 #5 Spring Ridge Dr
- 26107 Maplewood Dr
- 25206 Spring Ridge Dr
- 31003 N Head Dr
- 1407 Buchans Dr
- 119 Heatherwood Dr
- 1306 Caraquet Dr
- 0 Sagewood
- 602 Loggers Chase Ct
- 610 Loggers Chase Ct
- 0 Hanna Rd Unit 29809003
- 0 Hanna Rd Unit 16823099
- 607 Loggers Chase Ct
- 25706 Gamewood Ct
- 25702 Gamewood Ct
- 25603 Oakridge Forest Ln
- 603 Loggers Chase Ct
- 25607 Oakridge Forest Ln
- 25703 Gamewood Ct
- 25611 Oakridge Forest Ln
- 25710 Gamewood Ct
- 25622 Oakridge Forest Ln
- 710 Loone Ct
- 25707 Gamewood Ct
- 25702 Oakridge Forest Ln
- 25623 Oakridge Forest Ln
- 25714 Gamewood Ct
- 25706 Oakridge Forest Ln