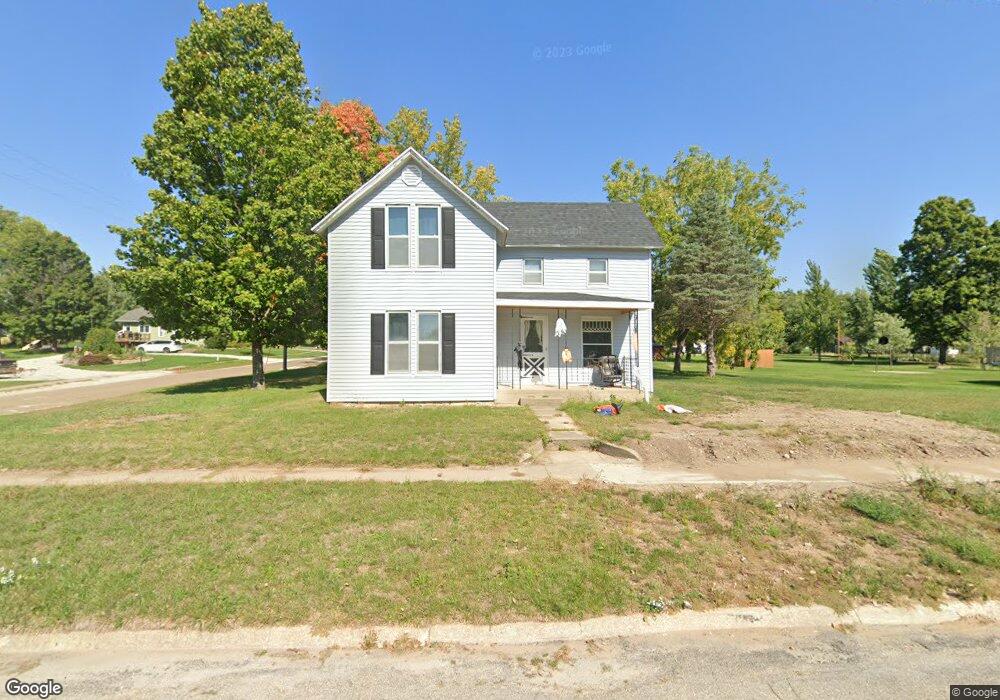
606 Main St Brandon, IA 52210
Estimated Value: $138,000 - $255,000
4
Beds
1
Bath
1,560
Sq Ft
$115/Sq Ft
Est. Value
About This Home
This home is located at 606 Main St, Brandon, IA 52210 and is currently estimated at $179,934, approximately $115 per square foot. 606 Main St is a home located in Buchanan County with nearby schools including West Elementary School, East Elementary School, and Independence Junior/Senior High School.
Ownership History
Date
Name
Owned For
Owner Type
Purchase Details
Closed on
Jul 24, 2024
Sold by
Boyer Ronald C and Boyer Barbara K
Bought by
Adams Cody
Current Estimated Value
Home Financials for this Owner
Home Financials are based on the most recent Mortgage that was taken out on this home.
Original Mortgage
$29,700
Interest Rate
6.95%
Mortgage Type
New Conventional
Create a Home Valuation Report for This Property
The Home Valuation Report is an in-depth analysis detailing your home's value as well as a comparison with similar homes in the area
Purchase History
| Date | Buyer | Sale Price | Title Company |
|---|---|---|---|
| Adams Cody | $148,500 | None Listed On Document |
Source: Public Records
Mortgage History
| Date | Status | Borrower | Loan Amount |
|---|---|---|---|
| Closed | Adams Cody | $29,700 | |
| Open | Adams Cody | $118,800 |
Source: Public Records
Tax History
| Year | Tax Paid | Tax Assessment Tax Assessment Total Assessment is a certain percentage of the fair market value that is determined by local assessors to be the total taxable value of land and additions on the property. | Land | Improvement |
|---|---|---|---|---|
| 2025 | $1,668 | $116,140 | $14,320 | $101,820 |
| 2024 | $1,668 | $99,100 | $12,780 | $86,320 |
| 2023 | $1,320 | $33,930 | $12,780 | $21,150 |
| 2022 | $1,280 | $72,470 | $10,150 | $62,320 |
| 2021 | $1,286 | $72,470 | $10,150 | $62,320 |
| 2020 | $1,286 | $67,280 | $8,950 | $58,330 |
| 2019 | $1,308 | $67,280 | $8,950 | $58,330 |
| 2018 | $1,260 | $65,520 | $8,950 | $56,570 |
| 2017 | $1,234 | $65,520 | $8,950 | $56,570 |
| 2016 | $1,208 | $62,280 | $5,680 | $56,600 |
| 2015 | $1,208 | $62,280 | $5,680 | $56,600 |
| 2014 | $1,236 | $62,280 | $5,680 | $56,600 |
Source: Public Records
Map
Nearby Homes
- 25th Avenue
- 705 South St
- 3251 Brandon Diagonal Blvd
- 0 25th Ave
- 0 Tbd 325th St
- 54th St
- TBD 54th St
- 0 Garling Rd
- 215 Traer St
- 302 Lewis St
- PARCEL "A" LOCA 55th St
- 5454 22nd Ave Unit Lot 24
- 5515 24th Avenue Dr
- TBD Jamestown Ave
- 00 Garling Rd
- 2332 55th Street Dr
- 0 31st Ave
- 0 51st St Ln Unit 2600145
- 5358 Hutton Dr
- 9438 Bryan Rd
Your Personal Tour Guide
Ask me questions while you tour the home.