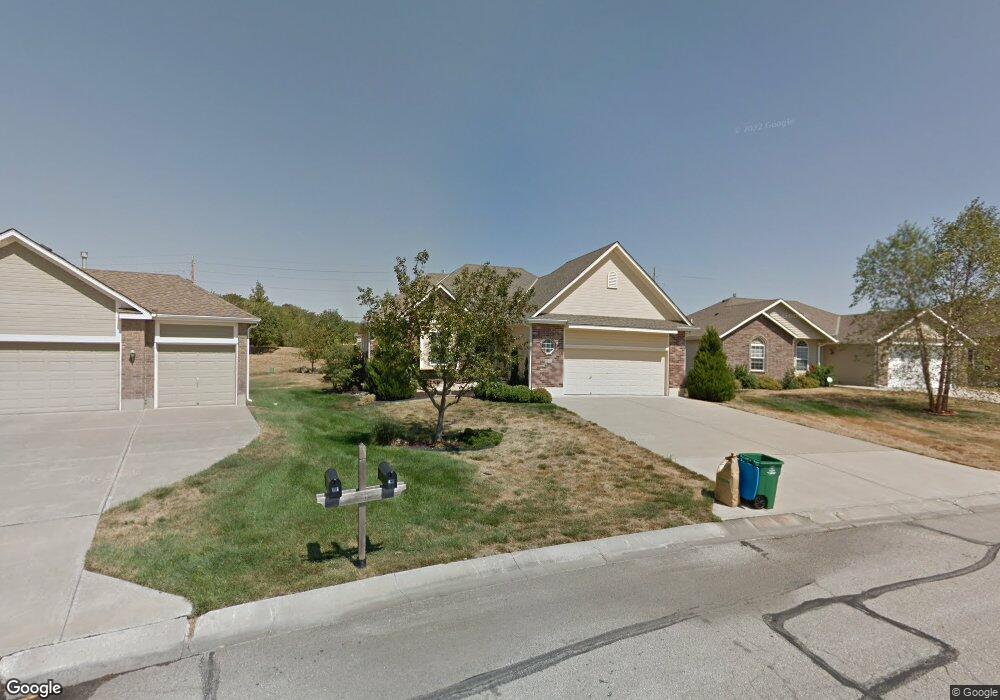
606 Meadowlark Place Raymore, MO 64083
Estimated Value: $313,000 - $351,000
3
Beds
2
Baths
1,358
Sq Ft
$249/Sq Ft
Est. Value
About This Home
This home is located at 606 Meadowlark Place, Raymore, MO 64083 and is currently estimated at $338,415, approximately $249 per square foot. 606 Meadowlark Place is a home located in Cass County with nearby schools including Stonegate Elementary School, Raymore-Peculiar South Middle School, and Raymore-Peculiar Senior High School.
Ownership History
Date
Name
Owned For
Owner Type
Purchase Details
Closed on
Sep 19, 2014
Sold by
Schmitt Larry T and Schmitt Martha R
Bought by
Baker Evelyn L
Current Estimated Value
Purchase Details
Closed on
Jul 24, 2009
Sold by
Schmitt Larry T and Schmitt Martha R
Bought by
Schmitt Larry T and Schmitt Martha R
Purchase Details
Closed on
Jun 2, 2009
Sold by
Schmitt Larry T and Schmitt Martha R
Bought by
Schmitt Larry T and Schmitt Martha R
Purchase Details
Closed on
Jul 11, 2008
Sold by
Schmitt Larry T and Schmitt Martha R
Bought by
Schmitt Larry T and Schmitt Martha R
Create a Home Valuation Report for This Property
The Home Valuation Report is an in-depth analysis detailing your home's value as well as a comparison with similar homes in the area
Home Values in the Area
Average Home Value in this Area
Purchase History
| Date | Buyer | Sale Price | Title Company |
|---|---|---|---|
| Baker Evelyn L | -- | None Available | |
| Schmitt Larry T | -- | -- | |
| Schmitt Larry T | -- | None Available | |
| Schmitt Larry T | -- | -- |
Source: Public Records
Tax History Compared to Growth
Tax History
| Year | Tax Paid | Tax Assessment Tax Assessment Total Assessment is a certain percentage of the fair market value that is determined by local assessors to be the total taxable value of land and additions on the property. | Land | Improvement |
|---|---|---|---|---|
| 2025 | $3,201 | $44,480 | $6,530 | $37,950 |
| 2024 | $3,201 | $39,330 | $5,940 | $33,390 |
| 2023 | $3,196 | $39,330 | $5,940 | $33,390 |
| 2022 | $2,826 | $34,540 | $5,940 | $28,600 |
| 2021 | $2,826 | $34,540 | $5,940 | $28,600 |
| 2020 | $2,821 | $33,870 | $5,940 | $27,930 |
| 2019 | $2,724 | $33,870 | $5,940 | $27,930 |
| 2018 | $2,522 | $30,290 | $4,950 | $25,340 |
| 2017 | $2,308 | $30,290 | $4,950 | $25,340 |
| 2016 | $2,308 | $28,770 | $4,950 | $23,820 |
| 2015 | $2,310 | $28,770 | $4,950 | $23,820 |
| 2014 | $2,311 | $28,770 | $4,950 | $23,820 |
| 2013 | -- | $28,770 | $4,950 | $23,820 |
Source: Public Records
Map
Nearby Homes
- 300 Dean Ave
- 502 Woodview Dr
- 500 Woodview Dr
- 415 Woodview Dr
- 413 Woodview Dr
- 411 Woodview Dr
- 409 Woodview Dr
- Heather Plan at Timber Trails
- Carbondale - Limited Availability Plan at Timber Trails
- Sunflower Plan at Timber Trails
- Westport - Limited Availability Plan at Timber Trails
- 408 Woodview Dr
- Winfield Plan at Timber Trails
- Somerset Plan at Timber Trails
- Marmalade - Limited Availability Plan at Timber Trails
- Basswood Plan at Timber Trails
- Wildflower Plan at Timber Trails
- Riverside Plan at Timber Trails
- Carolina Plan at Timber Trails
- Sheffield Plan at Timber Trails
- 604 Meadowlark Place
- 608 Meadowlark Place
- 602 Meadowlark Place
- 610 Meadowlark Place
- 605 Meadowlark Place
- 1932 Meadowlark Dr
- 612 Meadowlark Place
- 603 Meadowlark Place
- 601 Meadowlark Place
- 1930 Meadowlark Dr
- 2003 Sequoia Dr
- 2005 Sequoia Dr
- 1928 Meadowlark Dr
- 2001 Sequoia Dr
- 1933 Meadowlark Dr
- 1935 Meadowlark Dr
- 1913 Sequoia Dr
- 1931 Meadowlark Dr
- 1926 Meadowlark Dr
- 2007 Sequoia Dr