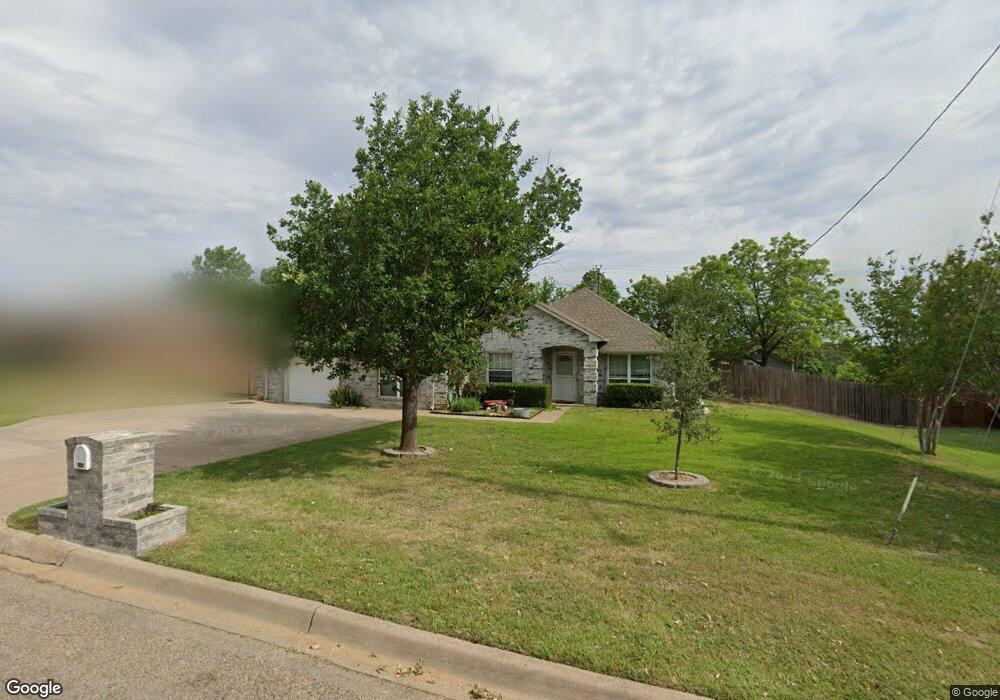
606 Pine Bluff St Cleburne, TX 76031
Estimated Value: $252,833 - $297,000
3
Beds
2
Baths
1,591
Sq Ft
$170/Sq Ft
Est. Value
About This Home
This home is located at 606 Pine Bluff St, Cleburne, TX 76031 and is currently estimated at $269,958, approximately $169 per square foot. 606 Pine Bluff St is a home located in Johnson County with nearby schools including Plum Creek Elementary School, Joshua High School - 9th Grade Campus, and Joshua High School.
Ownership History
Date
Name
Owned For
Owner Type
Purchase Details
Closed on
May 17, 2018
Sold by
Reiter Shirley Carol and Easley Shirley Carol
Bought by
Easley Charles Ellis
Current Estimated Value
Purchase Details
Closed on
Aug 8, 2016
Sold by
Garrick Stephen C and Garrick Randie L
Bought by
Easley Charles Ellis
Home Financials for this Owner
Home Financials are based on the most recent Mortgage that was taken out on this home.
Original Mortgage
$80,000
Interest Rate
3.48%
Mortgage Type
Construction
Purchase Details
Closed on
Mar 29, 2006
Sold by
Holland Roy C
Bought by
Lee Juanita
Purchase Details
Closed on
Sep 9, 2005
Sold by
Garrick Stephen C and Garrick Randie L
Bought by
Easley Charles E and Easley Shirley C
Home Financials for this Owner
Home Financials are based on the most recent Mortgage that was taken out on this home.
Original Mortgage
$87,500
Interest Rate
8.5%
Mortgage Type
Seller Take Back
Create a Home Valuation Report for This Property
The Home Valuation Report is an in-depth analysis detailing your home's value as well as a comparison with similar homes in the area
Home Values in the Area
Average Home Value in this Area
Purchase History
| Date | Buyer | Sale Price | Title Company |
|---|---|---|---|
| Easley Charles Ellis | -- | None Available | |
| Easley Charles Ellis | -- | None Available | |
| Lee Juanita | -- | None Available | |
| Easley Charles E | $90,000 | None Available |
Source: Public Records
Mortgage History
| Date | Status | Borrower | Loan Amount |
|---|---|---|---|
| Closed | Easley Charles Ellis | $80,000 | |
| Previous Owner | Easley Charles E | $87,500 |
Source: Public Records
Tax History
| Year | Tax Paid | Tax Assessment Tax Assessment Total Assessment is a certain percentage of the fair market value that is determined by local assessors to be the total taxable value of land and additions on the property. | Land | Improvement |
|---|---|---|---|---|
| 2025 | $3,485 | $240,718 | $45,000 | $195,718 |
| 2024 | $4,784 | $185,543 | $0 | $0 |
| 2023 | $2,949 | $223,324 | $25,000 | $198,324 |
| 2022 | $4,036 | $183,659 | $25,000 | $158,659 |
| 2021 | $3,714 | $154,791 | $25,000 | $129,791 |
| 2020 | $3,600 | $126,728 | $25,000 | $101,728 |
| 2019 | $3,527 | $126,728 | $25,000 | $101,728 |
| 2018 | $3,292 | $119,713 | $25,000 | $94,713 |
| 2017 | $2,790 | $98,282 | $25,000 | $73,282 |
| 2016 | $2,537 | $82,425 | $20,000 | $62,425 |
Source: Public Records
Map
Nearby Homes
- 3605 Mockingbird Cir
- 2812 County Road 805b
- 2405 County Road 805b
- 416 Linden St
- 3007 County Road 805b
- 503 N Fairview St Unit LOT 46
- 100 Hyline Dr
- 108 E Maple St
- 407 E Oakdale St
- 406 N Eastern St
- 100 Rosedale Ave
- 305 N Eastern St
- 104 S Old Mansfield Rd
- 209 S Old Mansfield Rd
- 117 Oakwood Dr
- 1460 County Road 701
- 109 2nd St
- 117 W 3rd St Unit A
- 207 Pine St
- 111 W 3rd St
- 608 Pine Bluff St
- 604 Pine Bluff St
- 1108 Snowberry St
- 602 Pine Bluff St
- 1109 Summer Wheat St
- 1109 Snowberry St
- 1106 Snowberry St
- 612 Pine Bluff St
- 600 Pine Bluff St
- 1107 Summer Wheat St
- 1107 Snowberry St
- 2417 County Road 805b
- 1106 Summer Wheat St
- 1105 Summer Wheat St
- 614 Pine Bluff St
- 2413 County Road 805b
- 1104 Summer Wheat St
- 1102 Snowberry St
- 1107 Willow Bend St
- 2409 County Road 805b
Your Personal Tour Guide
Ask me questions while you tour the home.