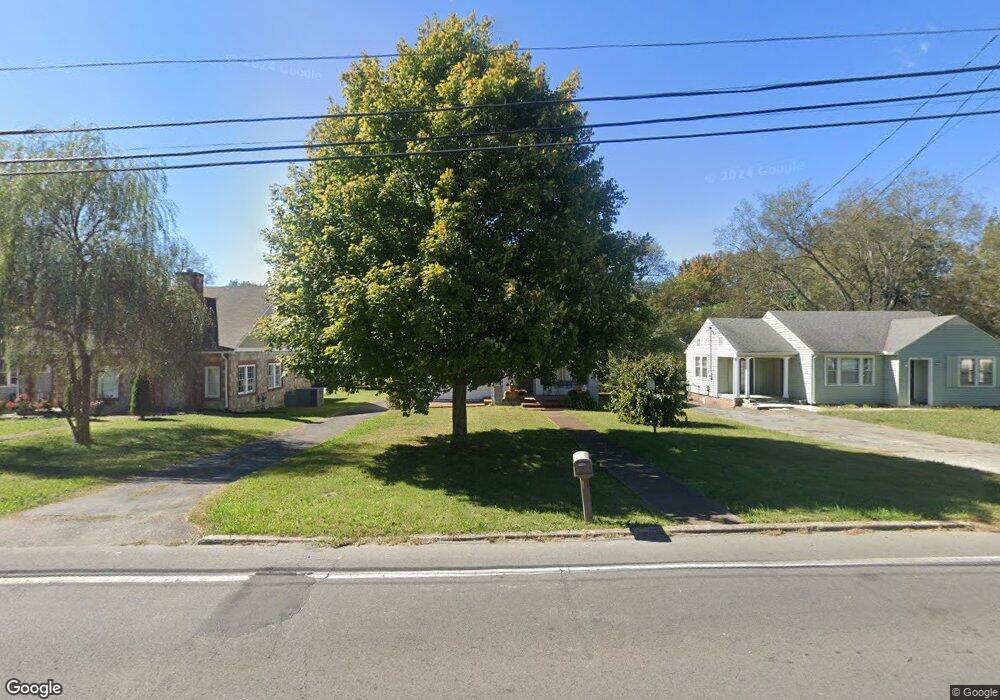
606 S Brittain St Shelbyville, TN 37160
Estimated Value: $210,094 - $358,000
--
Bed
1
Bath
2,554
Sq Ft
$108/Sq Ft
Est. Value
About This Home
This home is located at 606 S Brittain St, Shelbyville, TN 37160 and is currently estimated at $275,774, approximately $107 per square foot. 606 S Brittain St is a home located in Bedford County with nearby schools including East Side Elementary School, Harris Middle School, and Christian Chapel Academy.
Ownership History
Date
Name
Owned For
Owner Type
Purchase Details
Closed on
May 11, 2022
Sold by
Matthew Lokey Neil
Bought by
Lokey Neil Matthew
Current Estimated Value
Home Financials for this Owner
Home Financials are based on the most recent Mortgage that was taken out on this home.
Original Mortgage
$104,200
Outstanding Balance
$92,036
Interest Rate
4.52%
Mortgage Type
Balloon
Estimated Equity
$183,738
Purchase Details
Closed on
Apr 30, 2007
Sold by
Ortega Jamie Lynn Et Vir
Bought by
Lokey Neil Matthew
Purchase Details
Closed on
Oct 2, 2002
Sold by
Bank One National
Bought by
Bobo John T
Purchase Details
Closed on
Oct 26, 2000
Sold by
Davidson William T and Davidson Tracy
Bought by
Watkins Mikhael D and Watkins Cather
Purchase Details
Closed on
Apr 27, 1990
Bought by
Northcutt Lincoln B
Purchase Details
Closed on
Feb 5, 1985
Bought by
Cromwell Patricia W
Create a Home Valuation Report for This Property
The Home Valuation Report is an in-depth analysis detailing your home's value as well as a comparison with similar homes in the area
Home Values in the Area
Average Home Value in this Area
Purchase History
| Date | Buyer | Sale Price | Title Company |
|---|---|---|---|
| Lokey Neil Matthew | -- | None Listed On Document | |
| Lokey Neil Matthew | $126,000 | -- | |
| Bobo John T | $64,000 | -- | |
| Watkins Mikhael D | $87,900 | -- | |
| Northcutt Lincoln B | -- | -- | |
| Cromwell Patricia W | -- | -- |
Source: Public Records
Mortgage History
| Date | Status | Borrower | Loan Amount |
|---|---|---|---|
| Open | Lokey Neil Matthew | $104,200 |
Source: Public Records
Tax History Compared to Growth
Tax History
| Year | Tax Paid | Tax Assessment Tax Assessment Total Assessment is a certain percentage of the fair market value that is determined by local assessors to be the total taxable value of land and additions on the property. | Land | Improvement |
|---|---|---|---|---|
| 2025 | -- | $45,975 | $0 | $0 |
| 2024 | -- | $45,975 | $5,400 | $40,575 |
| 2023 | $1,749 | $45,975 | $5,400 | $40,575 |
| 2022 | $1,800 | $45,975 | $5,400 | $40,575 |
| 2021 | $1,635 | $45,975 | $5,400 | $40,575 |
| 2020 | $1,171 | $45,975 | $5,400 | $40,575 |
| 2019 | $1,179 | $26,425 | $2,875 | $23,550 |
| 2018 | $1,152 | $26,600 | $2,875 | $23,725 |
| 2017 | $1,152 | $26,600 | $2,875 | $23,725 |
| 2016 | $1,141 | $26,600 | $2,875 | $23,725 |
| 2015 | $1,141 | $26,600 | $2,875 | $23,725 |
| 2014 | $1,095 | $27,929 | $0 | $0 |
Source: Public Records
Map
Nearby Homes
- 120 Dogwood Ct
- 220 Walnut St
- 222 Carter St
- 709 Belmont Ave
- 0 E Depot St
- 418 Riverview Dr
- 611 Coble Cir
- 102 Germantown Rd
- 508 Lewis Ave
- 702 Adams Dr
- 600 Lewis Ave
- 112 Elizabeth St
- 211 S Fairoak St
- 215 Coney Island Rd
- 112 N Linda Dr
- 207 Martha St
- 464 Whitthorne St
- 527 Deery St
- 103 Davis St
- 125 Burrum Dr
- 608 S Brittain St
- 612 S Brittain St
- 602 S Brittain St
- 614 S Brittain St
- 600 S Brittain St
- 607 S Brittain St
- 611 S Brittain St
- 609 S Brittain St
- 603 S Brittain St
- 107 Scudder Dr
- 618 S Brittain St
- 613 S Brittain St
- 511 S Brittain St
- 622 S Brittain St
- 306 Oak St
- 615 S Brittain St
- 301 Oak St
- 621 S Brittain St
- 400 Oak St
- 303 Oak St