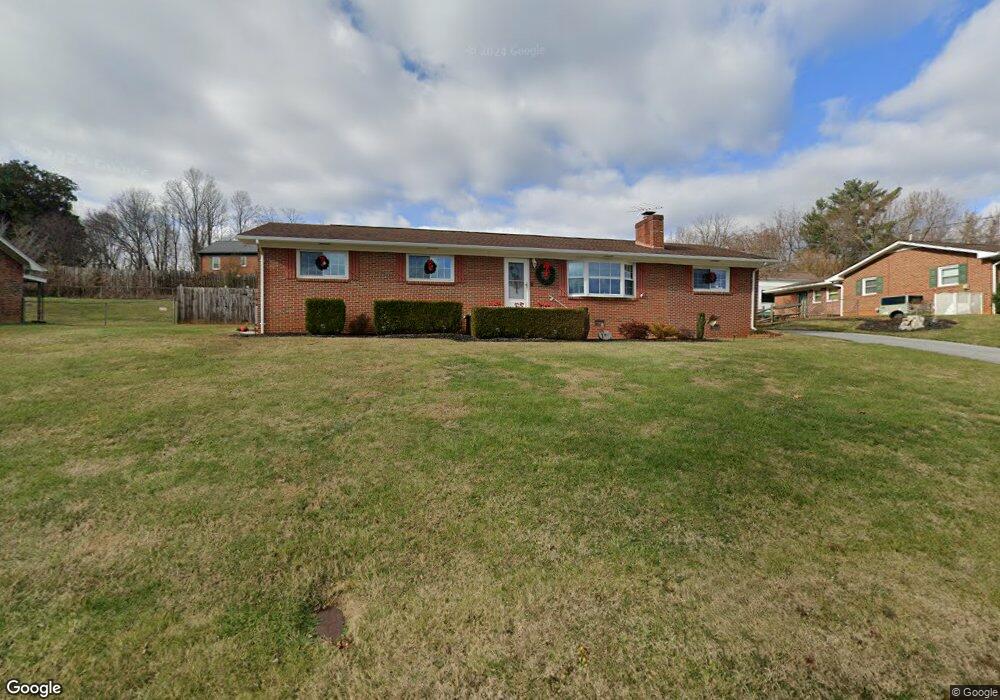
606 Southview Dr Johnson City, TN 37601
Estimated Value: $262,000 - $324,000
3
Beds
2
Baths
1,664
Sq Ft
$176/Sq Ft
Est. Value
About This Home
This home is located at 606 Southview Dr, Johnson City, TN 37601 and is currently estimated at $293,377, approximately $176 per square foot. 606 Southview Dr is a home located in Washington County with nearby schools including Mountain View Elementary School, Liberty Bell Middle School, and Indian Trail Middle School.
Ownership History
Date
Name
Owned For
Owner Type
Purchase Details
Closed on
Jul 1, 2019
Sold by
Crumley Michael E
Bought by
Crumley Michael E and Crumley Tammy J
Current Estimated Value
Purchase Details
Closed on
May 29, 2010
Sold by
Crumley Michael E
Bought by
Crumley Michael E
Home Financials for this Owner
Home Financials are based on the most recent Mortgage that was taken out on this home.
Original Mortgage
$136,452
Outstanding Balance
$74,009
Interest Rate
5.25%
Mortgage Type
FHA
Estimated Equity
$219,368
Purchase Details
Closed on
Jun 22, 2007
Sold by
Ramsey Robert W
Bought by
Crumley Michael E
Purchase Details
Closed on
May 14, 1996
Sold by
Ramsey Robert W and Ramsey Cathy
Bought by
Shilling Jay
Home Financials for this Owner
Home Financials are based on the most recent Mortgage that was taken out on this home.
Original Mortgage
$62,000
Interest Rate
8.02%
Purchase Details
Closed on
Jun 21, 1990
Bought by
Ramsey Robert W and Ramsey Cathy
Create a Home Valuation Report for This Property
The Home Valuation Report is an in-depth analysis detailing your home's value as well as a comparison with similar homes in the area
Home Values in the Area
Average Home Value in this Area
Purchase History
| Date | Buyer | Sale Price | Title Company |
|---|---|---|---|
| Crumley Michael E | -- | None Available | |
| Crumley Michael E | -- | -- | |
| Crumley Michael E | $131,000 | -- | |
| Shilling Jay | $84,500 | -- | |
| Ramsey Robert W | $58,500 | -- |
Source: Public Records
Mortgage History
| Date | Status | Borrower | Loan Amount |
|---|---|---|---|
| Open | Ramsey Robert W | $136,452 | |
| Previous Owner | Ramsey Robert W | $62,000 |
Source: Public Records
Tax History Compared to Growth
Tax History
| Year | Tax Paid | Tax Assessment Tax Assessment Total Assessment is a certain percentage of the fair market value that is determined by local assessors to be the total taxable value of land and additions on the property. | Land | Improvement |
|---|---|---|---|---|
| 2024 | $1,144 | $66,925 | $10,925 | $56,000 |
| 2022 | $862 | $40,100 | $9,550 | $30,550 |
| 2021 | $1,556 | $40,100 | $9,550 | $30,550 |
| 2020 | $1,548 | $40,100 | $9,550 | $30,550 |
| 2019 | $756 | $40,100 | $9,550 | $30,550 |
| 2018 | $1,356 | $31,750 | $6,000 | $25,750 |
| 2017 | $1,356 | $31,750 | $6,000 | $25,750 |
| 2016 | $1,350 | $31,750 | $6,000 | $25,750 |
| 2015 | $1,222 | $31,750 | $6,000 | $25,750 |
| 2014 | $1,143 | $31,750 | $6,000 | $25,750 |
Source: Public Records
Map
Nearby Homes
- Tbd Swadley Rd
- 805 E Maple St
- 1704 Orlando Dr
- 907 Cedar Grove Rd
- 0000 Plymouth Rd
- 9 Lynn Terrace Ct
- 197 Woodland Dr
- 322 Preservation Cir
- 188 Arlington Dr
- 515 Pilgrim Ct Unit D
- 515 Pilgrim Ct Unit B
- 518 Pilgrim Ct Unit D
- 506 Pilgrim Ct Unit B
- 908 Afton St
- 504 Pilgrim Ct Unit D
- 500 Pilgrim Ct Unit B
- 300 Peach Blossom Ct
- 112 W Chestnut St
- 71 Glaze Farm Way
- 203 E Locust St
- 604 Southview Dr
- 608 Southview Dr
- 607 Hiwassee Hill Dr SE
- 607 Hiwassee Hill Dr
- 607 Southview Dr
- 605 Southview Dr
- 609 Southview Dr
- 602 Southview Dr
- 603 Southview Dr
- 701 Hiwassee Hill Dr
- 613 Hiwassee Hill Dr
- 520 Southview Dr
- 610 Hiwassee Hill Dr
- 610 Hiwassee Hill Dr
- 610 Hiwassee Hill Dr
- 590 Southview Dr
- 604 Hiwassee Hill Extension
- 604 Hiwassee Hill Dr SE
- 604 Hiwassee Hill Extension
- 700 Hiwassee Hill Dr