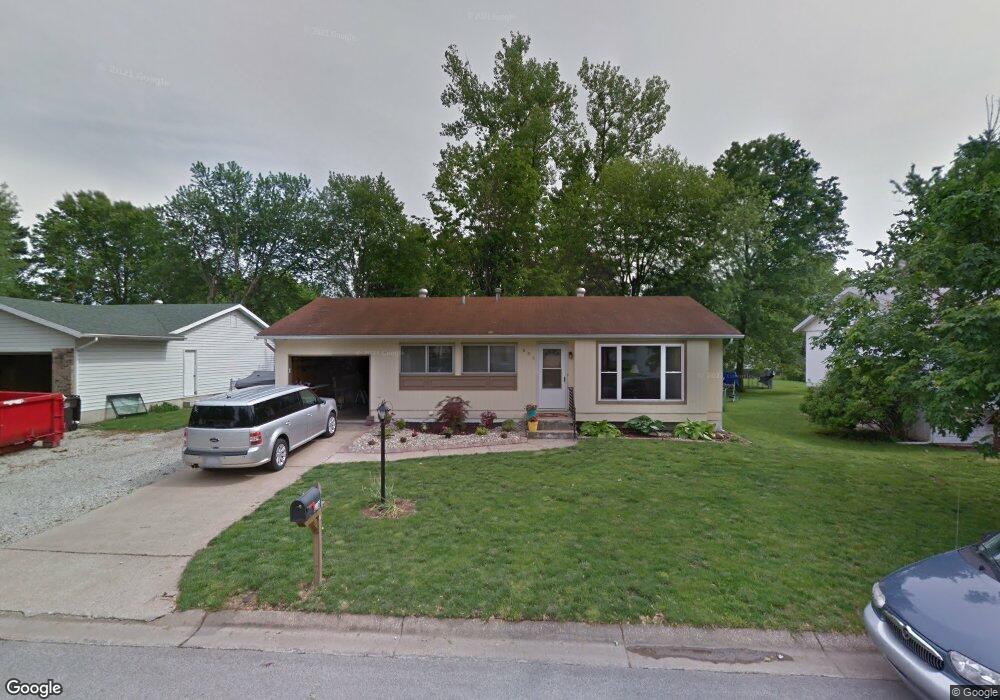
606 St Rose Dr Godfrey, IL 62035
Estimated Value: $156,000 - $204,000
3
Beds
2
Baths
1,044
Sq Ft
$172/Sq Ft
Est. Value
About This Home
This home is located at 606 St Rose Dr, Godfrey, IL 62035 and is currently estimated at $179,907, approximately $172 per square foot. 606 St Rose Dr is a home located in Madison County with nearby schools including Lewis & Clark Elementary School, Alton Middle School, and Alton High School.
Ownership History
Date
Name
Owned For
Owner Type
Purchase Details
Closed on
Aug 5, 2010
Sold by
Crowson Theresa L and Crowson Thomas L
Bought by
Mandorca Gina A
Current Estimated Value
Home Financials for this Owner
Home Financials are based on the most recent Mortgage that was taken out on this home.
Original Mortgage
$100,818
Outstanding Balance
$66,515
Interest Rate
4.5%
Mortgage Type
FHA
Estimated Equity
$113,392
Purchase Details
Closed on
Oct 12, 2009
Sold by
Beneficial Illinois Inc
Bought by
Cronson Theresa L and Crowson Thomas L
Purchase Details
Closed on
Sep 25, 2009
Sold by
Mackelden Carla J
Bought by
Beneficial Illinois Inc
Purchase Details
Closed on
Jul 16, 2004
Sold by
Edelen Barbara Sue and Sloan Phyllis
Bought by
Mackelden Carla J
Home Financials for this Owner
Home Financials are based on the most recent Mortgage that was taken out on this home.
Original Mortgage
$64,800
Interest Rate
6.07%
Mortgage Type
Purchase Money Mortgage
Create a Home Valuation Report for This Property
The Home Valuation Report is an in-depth analysis detailing your home's value as well as a comparison with similar homes in the area
Home Values in the Area
Average Home Value in this Area
Purchase History
| Date | Buyer | Sale Price | Title Company |
|---|---|---|---|
| Mandorca Gina A | $116,000 | Community Title & Escrow Ltd | |
| Cronson Theresa L | $65,000 | Fatic | |
| Beneficial Illinois Inc | -- | Fatic | |
| Mackelden Carla J | $81,000 | Chicago Title |
Source: Public Records
Mortgage History
| Date | Status | Borrower | Loan Amount |
|---|---|---|---|
| Open | Mandorca Gina A | $100,818 | |
| Previous Owner | Mackelden Carla J | $64,800 | |
| Closed | Mackelden Carla J | $16,200 |
Source: Public Records
Tax History Compared to Growth
Tax History
| Year | Tax Paid | Tax Assessment Tax Assessment Total Assessment is a certain percentage of the fair market value that is determined by local assessors to be the total taxable value of land and additions on the property. | Land | Improvement |
|---|---|---|---|---|
| 2024 | $3,230 | $53,900 | $4,930 | $48,970 |
| 2023 | $3,230 | $49,760 | $4,550 | $45,210 |
| 2022 | $3,053 | $45,500 | $4,160 | $41,340 |
| 2021 | $2,739 | $42,790 | $3,910 | $38,880 |
| 2020 | $2,681 | $41,870 | $3,830 | $38,040 |
| 2019 | $2,735 | $40,780 | $3,730 | $37,050 |
| 2018 | $2,687 | $39,040 | $3,570 | $35,470 |
| 2017 | $2,558 | $39,040 | $3,570 | $35,470 |
| 2016 | $2,485 | $39,040 | $3,570 | $35,470 |
| 2015 | $2,223 | $37,810 | $3,460 | $34,350 |
| 2014 | $2,223 | $37,810 | $3,460 | $34,350 |
| 2013 | $2,223 | $37,810 | $3,460 | $34,350 |
Source: Public Records
Map
Nearby Homes
- 223 Bachman Ln
- 421 Saint John Dr
- 123 Tolle Ln
- 5707 Humbert Rd
- 410 Chelsea Ct
- 504 Elm St
- 607 Mulberry St
- 5667 Humbert Rd
- 5661 Humbert Rd
- 5775 Roach Rd
- 0 Humbert Rd Unit MIS25052876
- 00 Pine Ridge Lot#52 Dr
- 212 Pine Ridge Dr
- 709 Stamper Ln
- 4805 Wick Mor Dr
- 709 Pardee Rd
- 5510 Lamotte Ln
- 5310 Godfrey Rd Unit 2
- 5504 Ladue Dr
- 4814 Azalea Place Unit 2
- 606 Saint Rose Dr
- 604 Saint Rose Dr
- 607 Saint Peter Dr
- 609 Saint Peter Dr
- 610 Saint Rose Dr
- 605 Saint Peter Dr
- 610 St Rose Dr
- 306 Saint Thomas Dr
- 304 Saint Thomas Dr
- 611 Saint Peter Dr
- 607 Saint Rose Dr
- 609 Saint Rose Dr
- 612 Saint Rose Dr
- 605 Saint Rose Dr
- 601 Saint Peter Dr
- 611 Saint Rose Dr
- 613 Saint Peter Dr
- 603 Saint Rose Dr
- 613 Saint Rose Dr
- 606 Saint Peter Dr