D
Seller's Agent in 2016
David Sodemann
Realty One Group Opening Doors
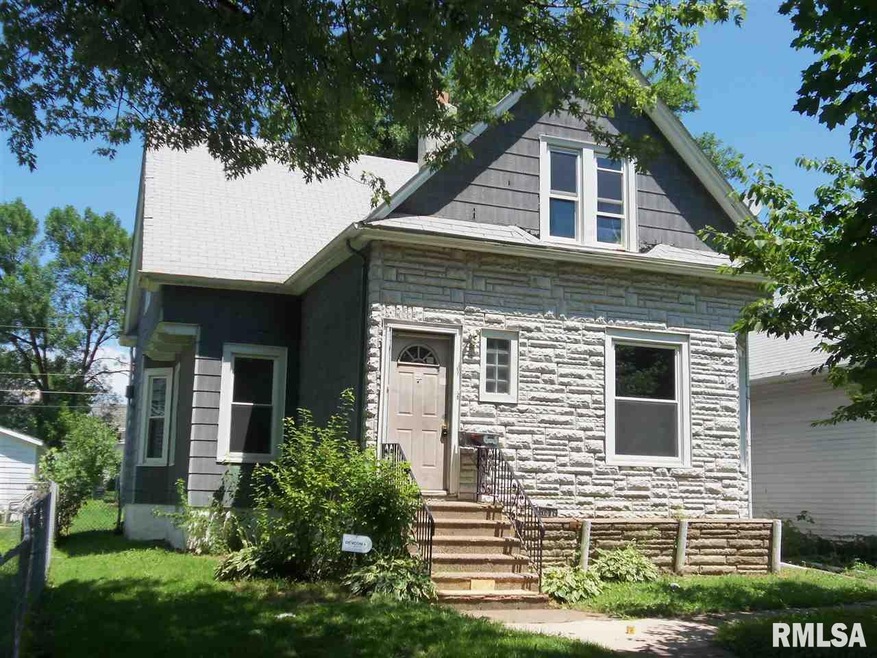


A lot of house for the money in this great 5 BR home with extra large 2 car garage. Conveniently located near parks, schools, shopping and more. All measurements are approximate and should be verified by buyer or buyers agent. This is a Fannie Mae Home Path property, all offer to be place online at homepath.com.
Last Agent to Sell the Property
Mel Foster Co. Davenport License #S40637000/475.125163 Listed on: 06/30/2015

Last Buyer's Agent
David Sodemann
Realty One Group Opening Doors License #S40846000
| Date | Type | Sale Price | Title Company |
|---|---|---|---|
| Warranty Deed | -- | -- | |
| Deed | -- | -- | |
| Special Warranty Deed | $35,000 | Servicelink | |
| Sheriffs Deed | $120,293 | None Available | |
| Warranty Deed | $87,500 | None Available | |
| Warranty Deed | $74,500 | None Available | |
| Special Warranty Deed | -- | None Available | |
| Warranty Deed | $62,000 | None Available | |
| Sheriffs Deed | $72,664 | None Available |
| Date | Status | Loan Amount | Loan Type |
|---|---|---|---|
| Open | $92,346 | FHA | |
| Closed | $93,180 | FHA | |
| Previous Owner | $85,914 | No Value Available | |
| Previous Owner | -- | No Value Available | |
| Previous Owner | $42,000 | Commercial | |
| Previous Owner | $87,425 | New Conventional | |
| Previous Owner | $73,900 | New Conventional |
| Date | Event | Price | Change | Sq Ft Price |
|---|---|---|---|---|
| 03/14/2016 03/14/16 | Sold | $87,500 | 0.0% | $39 / Sq Ft |
| 01/19/2016 01/19/16 | Pending | -- | -- | -- |
| 01/06/2016 01/06/16 | For Sale | $87,500 | +150.0% | $39 / Sq Ft |
| 09/30/2015 09/30/15 | Sold | $35,000 | -36.9% | $16 / Sq Ft |
| 09/21/2015 09/21/15 | Pending | -- | -- | -- |
| 06/30/2015 06/30/15 | For Sale | $55,500 | -- | $25 / Sq Ft |
| Year | Tax Paid | Tax Assessment Tax Assessment Total Assessment is a certain percentage of the fair market value that is determined by local assessors to be the total taxable value of land and additions on the property. | Land | Improvement |
|---|---|---|---|---|
| 2024 | $2,547 | $114,690 | $13,330 | $101,360 |
| 2023 | $2,514 | $114,690 | $13,330 | $101,360 |
| 2022 | $2,612 | $109,020 | $6,560 | $102,460 |
| 2021 | $2,282 | $106,350 | $6,560 | $99,790 |
| 2020 | $2,080 | $97,440 | $6,560 | $90,880 |
| 2019 | $1,856 | $91,200 | $6,560 | $84,640 |
| 2018 | $1,812 | $91,200 | $6,560 | $84,640 |
| 2017 | $1,051 | $91,200 | $6,560 | $84,640 |
| 2016 | $1,386 | $63,300 | $0 | $0 |
| 2015 | $1,386 | $66,570 | $0 | $0 |
| 2014 | $1,286 | $66,570 | $0 | $0 |
| 2013 | $1,258 | $0 | $0 | $0 |
| 2012 | -- | $80,090 | $7,320 | $72,770 |
D
Seller's Agent in 2016
David Sodemann
Realty One Group Opening Doors
Buyer's Agent in 2016
Dan Metzger
KW 1Advantage
(309) 737-6157
23 Total Sales
Seller's Agent in 2015
Norman Marcov
[Mel Foster Brand]
(563) 579-5552
82 Total Sales
Source: RMLS Alliance
MLS Number: RMAQC4163066
APN: G0012-35
Disclaimer: Certain information contained herein is derived from information provided by parties other than Homes.com. All information provided is deemed reliable, but is not guaranteed to be accurate and should be independently verified.
![]() IDX information is provided exclusively for personal, non-commercial use, and may not be used for any purpose other than to identify prospective properties consumers may be interested in purchasing. Information is deemed reliable but not guaranteed.
IDX information is provided exclusively for personal, non-commercial use, and may not be used for any purpose other than to identify prospective properties consumers may be interested in purchasing. Information is deemed reliable but not guaranteed.