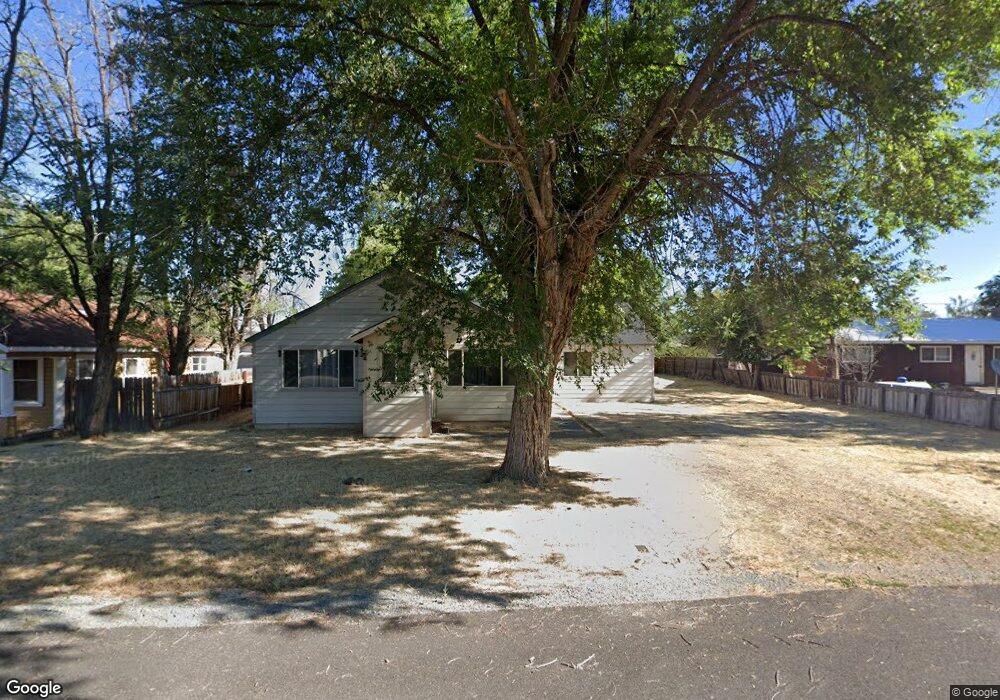
606 W 3rd St Alturas, CA 96101
Estimated Value: $115,000 - $198,000
4
Beds
3
Baths
1,503
Sq Ft
$110/Sq Ft
Est. Value
About This Home
This home is located at 606 W 3rd St, Alturas, CA 96101 and is currently estimated at $164,611, approximately $109 per square foot. 606 W 3rd St is a home located in Modoc County with nearby schools including Modoc High School and New Day Academy.
Ownership History
Date
Name
Owned For
Owner Type
Purchase Details
Closed on
Apr 20, 2022
Sold by
Greene Jr William A and Greene Ginger S
Bought by
Gonzales Sacramento
Current Estimated Value
Create a Home Valuation Report for This Property
The Home Valuation Report is an in-depth analysis detailing your home's value as well as a comparison with similar homes in the area
Home Values in the Area
Average Home Value in this Area
Purchase History
| Date | Buyer | Sale Price | Title Company |
|---|---|---|---|
| Gonzales Sacramento | $62,000 | New Title Company Name |
Source: Public Records
Tax History
| Year | Tax Paid | Tax Assessment Tax Assessment Total Assessment is a certain percentage of the fair market value that is determined by local assessors to be the total taxable value of land and additions on the property. | Land | Improvement |
|---|---|---|---|---|
| 2025 | $1,123 | $88,248 | $6,419 | $81,829 |
| 2024 | $1,123 | $86,519 | $6,294 | $80,225 |
| 2023 | $1,106 | $84,823 | $6,171 | $78,652 |
| 2022 | $1,234 | $97,580 | $9,741 | $87,839 |
| 2021 | $1,002 | $95,667 | $9,550 | $86,117 |
| 2020 | $992 | $94,687 | $9,453 | $85,234 |
| 2019 | $973 | $92,831 | $9,268 | $83,563 |
| 2018 | $955 | $91,012 | $9,087 | $81,925 |
| 2017 | $937 | $89,228 | $8,909 | $80,319 |
| 2016 | $920 | $87,480 | $8,735 | $78,745 |
| 2015 | $907 | $86,167 | $8,604 | $77,563 |
| 2014 | $890 | $84,480 | $8,436 | $76,044 |
Source: Public Records
Map
Nearby Homes
Your Personal Tour Guide
Ask me questions while you tour the home.