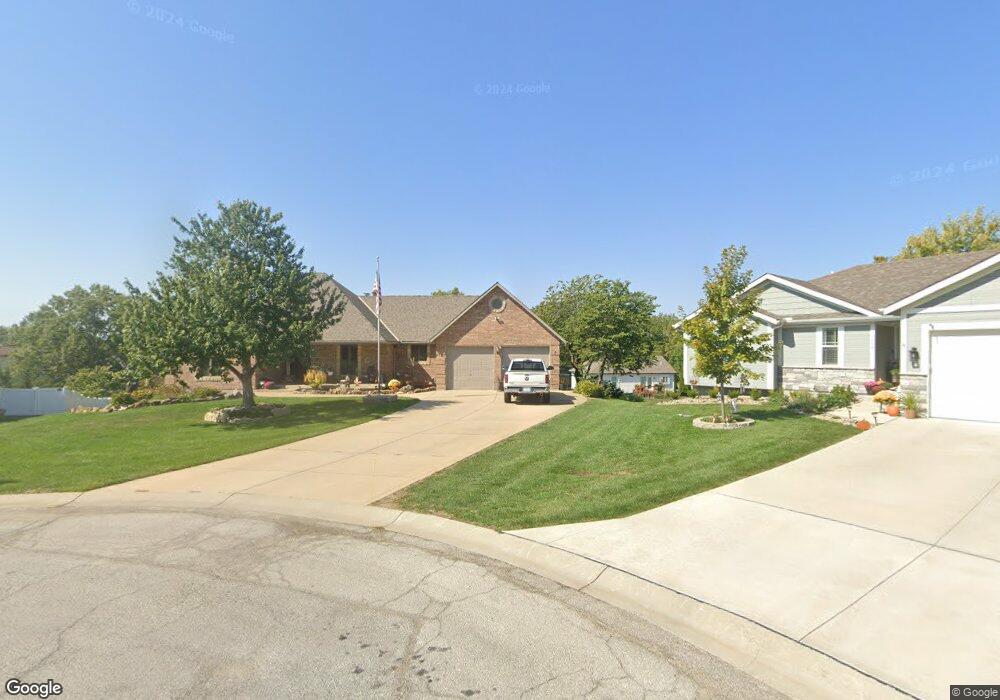
606 W Olive St Raymore, MO 64083
Estimated Value: $373,000 - $426,000
3
Beds
3
Baths
1,869
Sq Ft
$215/Sq Ft
Est. Value
About This Home
This home is located at 606 W Olive St, Raymore, MO 64083 and is currently estimated at $401,130, approximately $214 per square foot. 606 W Olive St is a home located in Cass County with nearby schools including Raymore Elementary School, Raymore-Peculiar East Middle School, and Raymore-Peculiar Senior High School.
Ownership History
Date
Name
Owned For
Owner Type
Purchase Details
Closed on
Mar 15, 2019
Sold by
James H Spalding Trust
Bought by
Bestgen Wade L and Bestgen Sandra D
Current Estimated Value
Home Financials for this Owner
Home Financials are based on the most recent Mortgage that was taken out on this home.
Original Mortgage
$228,600
Outstanding Balance
$200,161
Interest Rate
4.4%
Mortgage Type
New Conventional
Estimated Equity
$200,969
Purchase Details
Closed on
Feb 24, 2014
Sold by
Spalding James H
Bought by
Spalding James H and James H Spalding Trust
Create a Home Valuation Report for This Property
The Home Valuation Report is an in-depth analysis detailing your home's value as well as a comparison with similar homes in the area
Home Values in the Area
Average Home Value in this Area
Purchase History
| Date | Buyer | Sale Price | Title Company |
|---|---|---|---|
| Bestgen Wade L | -- | Crescent Land Title | |
| Spalding James H | -- | None Available |
Source: Public Records
Mortgage History
| Date | Status | Borrower | Loan Amount |
|---|---|---|---|
| Open | Bestgen Wade L | $228,600 |
Source: Public Records
Tax History
| Year | Tax Paid | Tax Assessment Tax Assessment Total Assessment is a certain percentage of the fair market value that is determined by local assessors to be the total taxable value of land and additions on the property. | Land | Improvement |
|---|---|---|---|---|
| 2025 | $4,536 | $63,380 | $5,130 | $58,250 |
| 2024 | $4,536 | $55,740 | $4,670 | $51,070 |
| 2023 | $4,530 | $55,740 | $4,670 | $51,070 |
| 2022 | $4,023 | $49,170 | $4,670 | $44,500 |
| 2021 | $4,023 | $49,170 | $4,670 | $44,500 |
| 2020 | $3,931 | $47,190 | $4,670 | $42,520 |
| 2019 | $3,795 | $47,190 | $4,670 | $42,520 |
| 2018 | $3,531 | $42,400 | $3,990 | $38,410 |
| 2017 | $3,242 | $42,400 | $3,990 | $38,410 |
| 2016 | $3,242 | $40,410 | $3,990 | $36,420 |
| 2015 | $3,244 | $40,410 | $3,990 | $36,420 |
| 2014 | $3,246 | $40,410 | $3,990 | $36,420 |
| 2013 | -- | $40,410 | $3,990 | $36,420 |
Source: Public Records
Map
Nearby Homes
- 600 W Buena Vista Dr
- 108 Rainbow Cir
- 205 N Pacific Ct
- 201 Johnston Dr
- 208 N Pacific Ct
- 416 S Jefferson St
- 222 N Madison St
- 105 N Landcaster Dr
- 205 Johnston Pkwy
- 506 S Adams St
- 615 N Conway St
- 204 N Pointe Ln
- 219 Pointe Ln
- 1105 Brookside Place
- 901 W Lucy Webb Rd
- 713 S Sunset Ln
- 211 S Franklin St
- 113 N Eastglen Dr
- 709 Derby St
- 317 & 319 W Foxwood Dr
Your Personal Tour Guide
Ask me questions while you tour the home.