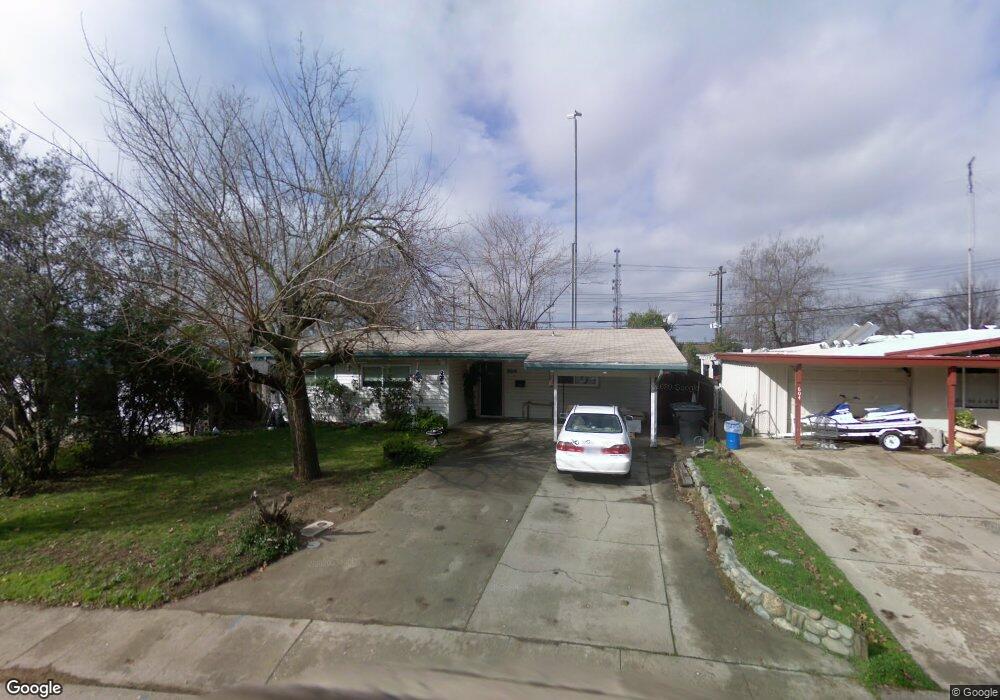
606 Wemberly Dr Roseville, CA 95678
Theiles Manor NeighborhoodEstimated Value: $285,000 - $448,000
3
Beds
1
Bath
1,221
Sq Ft
$304/Sq Ft
Est. Value
About This Home
This home is located at 606 Wemberly Dr, Roseville, CA 95678 and is currently estimated at $371,127, approximately $303 per square foot. 606 Wemberly Dr is a home located in Placer County with nearby schools including George Cirby Elementary School, Warren T. Eich Middle School, and Oakmont High School.
Ownership History
Date
Name
Owned For
Owner Type
Purchase Details
Closed on
May 24, 2010
Sold by
Powell David E
Bought by
Powell David and Powell Stephanie
Current Estimated Value
Purchase Details
Closed on
May 18, 2010
Sold by
Fannie Mae
Bought by
Powell David E
Purchase Details
Closed on
May 17, 2010
Sold by
Powell Stephanie J
Bought by
Powell David E
Purchase Details
Closed on
Feb 5, 2010
Sold by
Pennington Curtis and Pennington Teresa
Bought by
Federal National Mortgage Association
Purchase Details
Closed on
Jun 13, 2002
Sold by
Love Alan W and Love Laurel A
Bought by
Pennington Curtis and Pennington Teresa
Home Financials for this Owner
Home Financials are based on the most recent Mortgage that was taken out on this home.
Original Mortgage
$179,075
Interest Rate
6.74%
Mortgage Type
FHA
Create a Home Valuation Report for This Property
The Home Valuation Report is an in-depth analysis detailing your home's value as well as a comparison with similar homes in the area
Home Values in the Area
Average Home Value in this Area
Purchase History
| Date | Buyer | Sale Price | Title Company |
|---|---|---|---|
| Powell David | -- | Lawyers Title Sd | |
| Powell David E | $92,000 | Lawyers Ttile Sd | |
| Powell David E | -- | Lawyers Title Sd | |
| Federal National Mortgage Association | $290,309 | Accommodation | |
| Pennington Curtis | $174,000 | Placer Title Company |
Source: Public Records
Mortgage History
| Date | Status | Borrower | Loan Amount |
|---|---|---|---|
| Previous Owner | Pennington Curtis | $179,075 |
Source: Public Records
Tax History Compared to Growth
Tax History
| Year | Tax Paid | Tax Assessment Tax Assessment Total Assessment is a certain percentage of the fair market value that is determined by local assessors to be the total taxable value of land and additions on the property. | Land | Improvement |
|---|---|---|---|---|
| 2025 | $1,240 | $118,580 | $51,627 | $66,953 |
| 2023 | $1,240 | $113,977 | $49,623 | $64,354 |
| 2022 | $1,220 | $111,743 | $48,650 | $63,093 |
| 2021 | $1,192 | $109,553 | $47,697 | $61,856 |
| 2020 | $1,188 | $108,430 | $47,208 | $61,222 |
| 2019 | $1,171 | $106,305 | $46,283 | $60,022 |
| 2018 | $1,127 | $104,222 | $45,376 | $58,846 |
| 2017 | $1,115 | $102,180 | $44,487 | $57,693 |
| 2016 | $1,123 | $100,177 | $43,615 | $56,562 |
| 2015 | $1,101 | $98,673 | $42,960 | $55,713 |
| 2014 | $1,084 | $96,741 | $42,119 | $54,622 |
Source: Public Records
Map
Nearby Homes
- 404 5th St
- 1675 Vernon St Unit 61
- 1675 Vernon St Unit 51
- 308 6th St
- 231 D St
- 406 Cameron Way
- 219 B St
- 1006 Northridge Dr
- 113 Duncan Way
- 1106 Circuit Dr
- 1020 Church St
- 1335 Trevor Way
- 1100 Oakland Ave
- 213 Live Oak Cir
- 305 Jesse Ave
- 305 Union St
- 602 George Ln
- 1408 Santa fe Cir
- 417 Douglas Blvd
- 1208 Glenbrook Ave