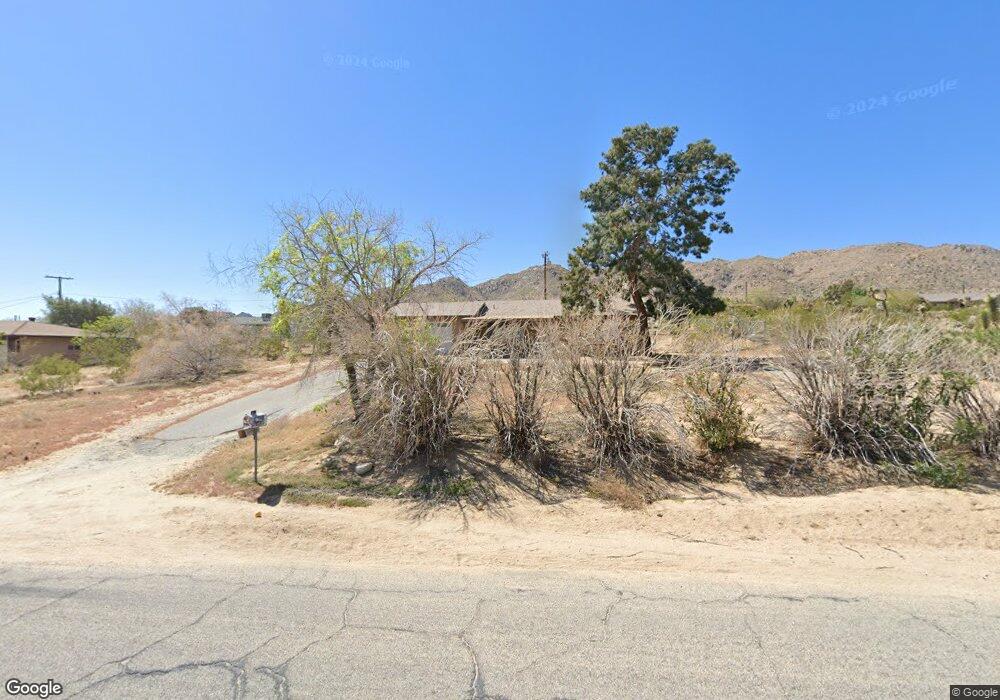
60615 Latham Trail Joshua Tree, CA 92252
Estimated Value: $283,000 - $447,000
2
Beds
1
Bath
864
Sq Ft
$391/Sq Ft
Est. Value
About This Home
This home is located at 60615 Latham Trail, Joshua Tree, CA 92252 and is currently estimated at $338,043, approximately $391 per square foot. 60615 Latham Trail is a home located in San Bernardino County with nearby schools including Friendly Hills Elementary School, La Contenta Middle School, and Yucca Valley High School.
Ownership History
Date
Name
Owned For
Owner Type
Purchase Details
Closed on
Nov 5, 2020
Sold by
Luersen James and Luersen Dawn A
Bought by
Lursen James G and Lauersen Dawn A
Current Estimated Value
Home Financials for this Owner
Home Financials are based on the most recent Mortgage that was taken out on this home.
Original Mortgage
$127,500
Outstanding Balance
$113,660
Interest Rate
2.9%
Mortgage Type
New Conventional
Estimated Equity
$224,383
Purchase Details
Closed on
Aug 21, 2009
Sold by
Luersen James G
Bought by
Luersen James G and Luersen Dawn A
Home Financials for this Owner
Home Financials are based on the most recent Mortgage that was taken out on this home.
Original Mortgage
$75,000
Interest Rate
5.09%
Mortgage Type
New Conventional
Purchase Details
Closed on
Jan 8, 2007
Sold by
Luersen James G
Bought by
Luersen James G and Luersen Dawn A
Create a Home Valuation Report for This Property
The Home Valuation Report is an in-depth analysis detailing your home's value as well as a comparison with similar homes in the area
Home Values in the Area
Average Home Value in this Area
Purchase History
| Date | Buyer | Sale Price | Title Company |
|---|---|---|---|
| Lursen James G | -- | Accommodation | |
| Luersen James | -- | Lawyers Title Sd | |
| Luersen James G | -- | Accommodation | |
| Luersen James G | -- | Fidelity National Title Co | |
| Luersen James G | -- | None Available |
Source: Public Records
Mortgage History
| Date | Status | Borrower | Loan Amount |
|---|---|---|---|
| Open | Luersen James | $127,500 | |
| Previous Owner | Luersen James G | $75,000 |
Source: Public Records
Tax History Compared to Growth
Tax History
| Year | Tax Paid | Tax Assessment Tax Assessment Total Assessment is a certain percentage of the fair market value that is determined by local assessors to be the total taxable value of land and additions on the property. | Land | Improvement |
|---|---|---|---|---|
| 2025 | $1,472 | $103,266 | $19,362 | $83,904 |
| 2024 | $1,472 | $101,241 | $18,982 | $82,259 |
| 2023 | $1,445 | $99,256 | $18,610 | $80,646 |
| 2022 | $1,417 | $97,310 | $18,245 | $79,065 |
| 2021 | $1,400 | $95,402 | $17,887 | $77,515 |
| 2020 | $1,388 | $94,424 | $17,704 | $76,720 |
| 2019 | $1,453 | $92,573 | $17,357 | $75,216 |
| 2018 | $1,282 | $90,758 | $17,017 | $73,741 |
| 2017 | $1,270 | $88,978 | $16,683 | $72,295 |
| 2016 | $1,250 | $87,233 | $16,356 | $70,877 |
| 2015 | $1,226 | $85,922 | $16,110 | $69,812 |
| 2014 | $1,234 | $84,238 | $15,794 | $68,444 |
Source: Public Records
Map
Nearby Homes
- 60601 La Mirada Trail
- 0 La Mirada Trail
- 60374 La Mirada Trail
- 60633 Pueblo Trail
- 60467 Natoma Trail
- 7320 Sherwood Rd
- 60423 La Mirada Trail
- 60377 Pueblo Trail
- 0 Melton Trail Unit JT25242563
- 0 Latham Trail Unit 219133231DA
- 60400 Adobe Dr
- 60383 Melton Trail
- 60307 Alta Loma Dr
- 7677 Wilton Rd
- 61246 Melton Trail
- 60255 Natoma Trail
- 60219 Latham Trail
- 60150 Adobe Rd
- 7217 Sunny Vista Rd
- 60205 Latham Trail
- 60629 Latham Trail
- 60616 La Mirada Trail
- 60622 Latham Trail
- 60649 Latham Trail
- 60644 Latham Trail
- 60586 Latham Trail
- 60650 La Mirada Trail
- 60565 Latham Trail
- 60566 Latham Trail
- 60619 Natoma Trail
- 60615 La Mirada Trail
- 60668 La Mirada Trail
- 60631 La Mirada Trail
- 60637 Natoma Trail
- 60547 Latham Trail
- 60581 La Mirada Trail
- 60542 La Mirada Trail
- 60649 La Mirada Trail
- 60542 Latham Trail
- 60672 Latham Trail