Estimated Value: $689,000 - $716,000
3
Beds
2
Baths
1,418
Sq Ft
$495/Sq Ft
Est. Value
About This Home
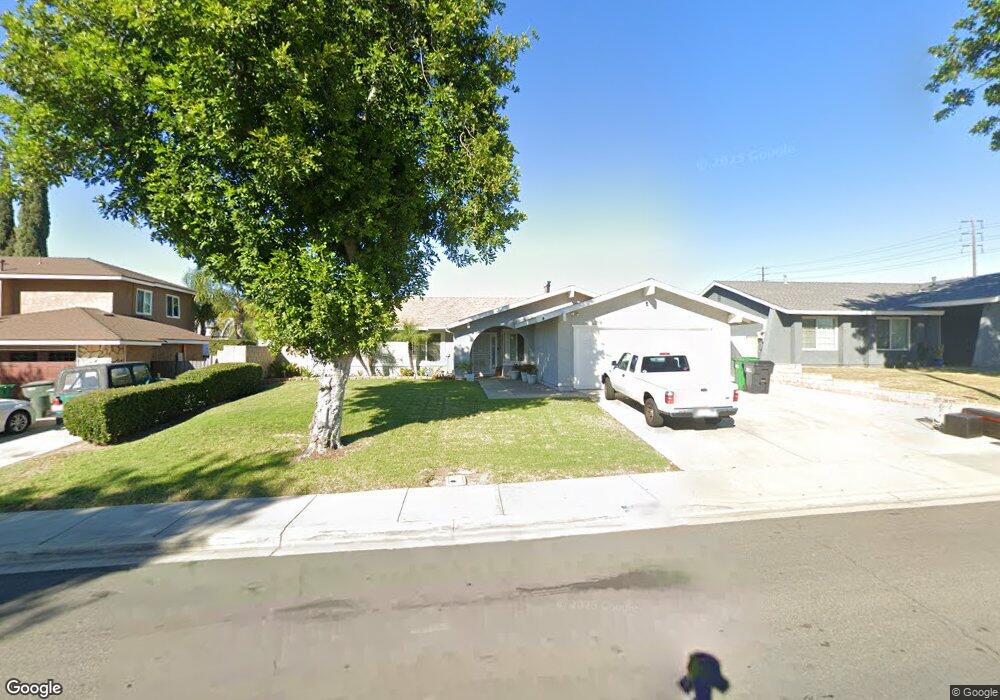
This home is located at 6064 Barbara St, Chino, CA 91710 and is currently estimated at $702,212, approximately $495 per square foot. 6064 Barbara St is a home located in San Bernardino County with nearby schools including Alicia Cortez Elementary, Magnolia Junior High, and Chino High School.
Ownership History
Date
Name
Owned For
Owner Type
Purchase Details
Closed on
Oct 26, 2022
Sold by
Murillo Lonnie M
Bought by
Lonnie M Murillo Revocable Trust and Murillo
Current Estimated Value
Purchase Details
Closed on
Apr 4, 2013
Sold by
Gurgian George and Gurgian Hortensia
Bought by
Gurgian George and Gurgian Hortensia
Home Financials for this Owner
Home Financials are based on the most recent Mortgage that was taken out on this home.
Original Mortgage
$163,704
Interest Rate
3.47%
Mortgage Type
New Conventional
Purchase Details
Closed on
Sep 17, 2010
Sold by
Gurgian George and Gurgian Hortensia
Bought by
The George Gurgian & Hortensia Martha Gu
Purchase Details
Closed on
Feb 18, 1998
Sold by
Payne Ronald D and Payne Marie A
Bought by
Gurgian George and Gurgian Hortensia
Home Financials for this Owner
Home Financials are based on the most recent Mortgage that was taken out on this home.
Original Mortgage
$120,650
Interest Rate
7.11%
Create a Home Valuation Report for This Property
The Home Valuation Report is an in-depth analysis detailing your home's value as well as a comparison with similar homes in the area
Home Values in the Area
Average Home Value in this Area
Purchase History
| Date | Buyer | Sale Price | Title Company |
|---|---|---|---|
| Lonnie M Murillo Revocable Trust | -- | None Listed On Document | |
| Gurgian George | -- | Advantage Title Inc | |
| Gurgian George | -- | Title365 Company | |
| The George Gurgian & Hortensia Martha Gu | -- | None Available | |
| Gurgian George | $127,000 | Ati Title Company |
Source: Public Records
Mortgage History
| Date | Status | Borrower | Loan Amount |
|---|---|---|---|
| Previous Owner | Gurgian George | $163,704 | |
| Previous Owner | Gurgian George | $120,650 |
Source: Public Records
Tax History Compared to Growth
Tax History
| Year | Tax Paid | Tax Assessment Tax Assessment Total Assessment is a certain percentage of the fair market value that is determined by local assessors to be the total taxable value of land and additions on the property. | Land | Improvement |
|---|---|---|---|---|
| 2025 | $2,138 | $202,393 | $50,618 | $151,775 |
| 2024 | $2,138 | $198,424 | $49,625 | $148,799 |
| 2023 | $2,078 | $194,533 | $48,652 | $145,881 |
| 2022 | $2,025 | $187,252 | $46,833 | $140,419 |
| 2021 | $1,985 | $183,581 | $45,915 | $137,666 |
| 2020 | $1,958 | $181,698 | $45,444 | $136,254 |
| 2019 | $1,923 | $178,135 | $44,553 | $133,582 |
| 2018 | $1,879 | $174,642 | $43,679 | $130,963 |
| 2017 | $1,844 | $171,218 | $42,823 | $128,395 |
| 2016 | $1,723 | $167,860 | $41,983 | $125,877 |
| 2015 | $1,688 | $165,338 | $41,352 | $123,986 |
| 2014 | $1,653 | $162,099 | $40,542 | $121,557 |
Source: Public Records
Map
Nearby Homes
- 6061 Barbara St
- 6031 Rosa Ct
- 5925 Riverside Dr Unit 12
- 12951 Red Cedar Way
- 12936 Cambridge Ct
- 12811 Oaks Ave
- 13014 Bermuda Ave
- 12796 17th St
- 12951 Benson Ave Unit 118
- 5640 Riverside Dr Unit 119
- 13185 14th St
- 6441 Susana St
- 13022 Cypress Ave
- 12524 Ross Ave
- 13006 Falcon Place
- 12836 12th St Unit 27
- 12947 Robin Ln
- 12689 Cypress Ave
- 13536 Sycamore Ln
- 13555 Magnolia Ave
- 6072 Barbara St
- 6052 Barbara St
- 6084 Barbara St
- 6048 Barbara St
- 6073 Barbara St
- 6057 Barbara St
- 6036 Barbara St
- 6096 Barbara St
- 6085 Barbara St
- 6045 Barbara St
- 12972 Magnolia Ave
- 6097 Barbara St
- 6033 Barbara St
- 6024 Barbara St
- 6062 Rosa Ct
- 6074 Rosa Ct
- 6058 Rosa Ct
- 6086 Rosa Ct
- 6021 Barbara St
- 6012 Barbara St