6065 325th St Toledo, OH 43611
Point Place NeighborhoodEstimated Value: $114,100 - $147,000
3
Beds
1
Bath
1,029
Sq Ft
$124/Sq Ft
Est. Value
About This Home
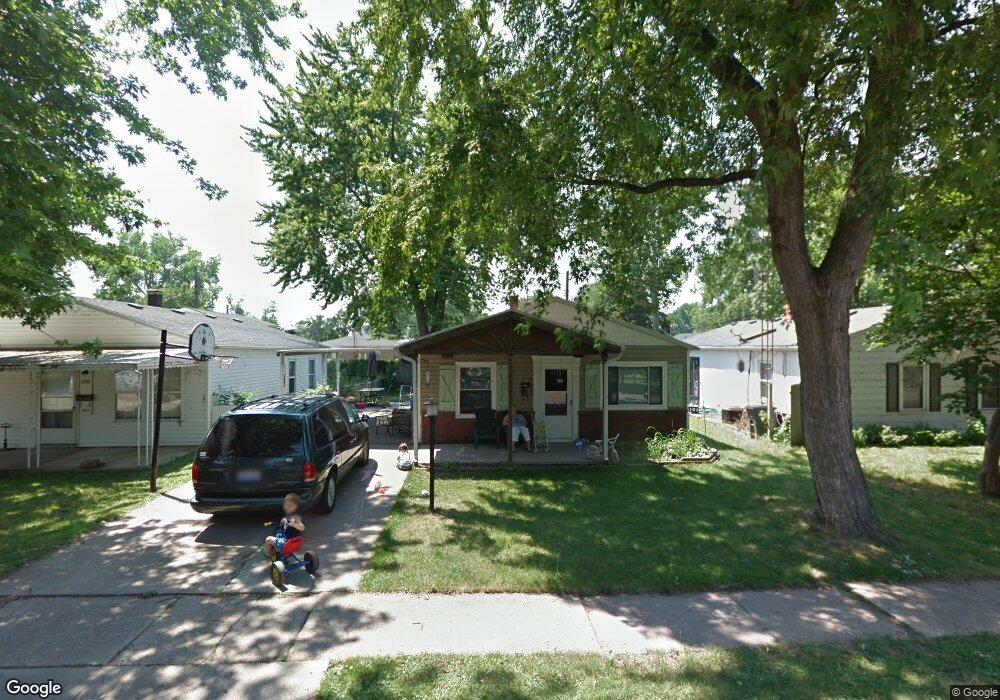
This home is located at 6065 325th St, Toledo, OH 43611 and is currently estimated at $127,275, approximately $123 per square foot. 6065 325th St is a home located in Lucas County with nearby schools including Edgewater Elementary School and Woodward High School.
Ownership History
Date
Name
Owned For
Owner Type
Purchase Details
Closed on
Mar 31, 1997
Sold by
Mcdaniel Nancy L
Bought by
Schlegel Free and Schlegel Destiny
Current Estimated Value
Home Financials for this Owner
Home Financials are based on the most recent Mortgage that was taken out on this home.
Original Mortgage
$49,110
Outstanding Balance
$5,005
Interest Rate
7.73%
Mortgage Type
New Conventional
Estimated Equity
$122,270
Purchase Details
Closed on
Jun 27, 1988
Sold by
Timmons Catherine Ann
Create a Home Valuation Report for This Property
The Home Valuation Report is an in-depth analysis detailing your home's value as well as a comparison with similar homes in the area
Home Values in the Area
Average Home Value in this Area
Purchase History
| Date | Buyer | Sale Price | Title Company |
|---|---|---|---|
| Schlegel Free | $48,000 | -- | |
| -- | $28,900 | -- |
Source: Public Records
Mortgage History
| Date | Status | Borrower | Loan Amount |
|---|---|---|---|
| Open | Schlegel Free | $49,110 |
Source: Public Records
Tax History
| Year | Tax Paid | Tax Assessment Tax Assessment Total Assessment is a certain percentage of the fair market value that is determined by local assessors to be the total taxable value of land and additions on the property. | Land | Improvement |
|---|---|---|---|---|
| 2025 | -- | $24,710 | $6,090 | $18,620 |
| 2024 | $771 | $24,710 | $6,090 | $18,620 |
| 2023 | $1,715 | $24,220 | $4,270 | $19,950 |
| 2022 | $1,569 | $24,220 | $4,270 | $19,950 |
| 2021 | $1,604 | $24,220 | $4,270 | $19,950 |
| 2020 | $1,528 | $20,230 | $3,570 | $16,660 |
| 2019 | $1,484 | $20,230 | $3,570 | $16,660 |
| 2018 | $1,492 | $20,230 | $3,570 | $16,660 |
| 2017 | $1,528 | $19,775 | $3,500 | $16,275 |
| 2016 | $1,528 | $56,500 | $10,000 | $46,500 |
| 2015 | $1,515 | $56,500 | $10,000 | $46,500 |
| 2014 | $1,244 | $19,780 | $3,500 | $16,280 |
| 2013 | $1,244 | $19,780 | $3,500 | $16,280 |
Source: Public Records
Map
Nearby Homes
Your Personal Tour Guide
Ask me questions while you tour the home.