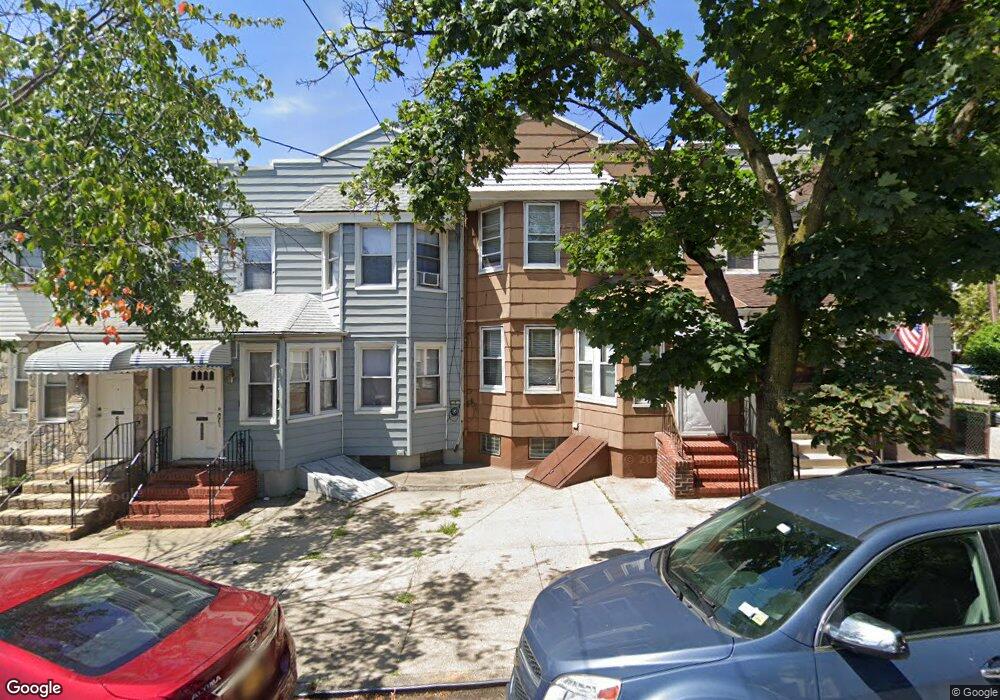
6065 80th Ave Glendale, NY 11385
Glendale NeighborhoodEstimated Value: $917,448 - $1,106,000
5
Beds
2
Baths
1,788
Sq Ft
$551/Sq Ft
Est. Value
About This Home
This home is located at 6065 80th Ave, Glendale, NY 11385 and is currently estimated at $984,362, approximately $550 per square foot. 6065 80th Ave is a home located in Queens County with nearby schools including P.S. 68 - Cambridge, Joseph F. Quinn Intermediate School 77, and Elm Community Charter School.
Ownership History
Date
Name
Owned For
Owner Type
Purchase Details
Closed on
Oct 3, 2016
Sold by
Real Property Llc
Bought by
Colon Keto and Colon Lizette
Current Estimated Value
Home Financials for this Owner
Home Financials are based on the most recent Mortgage that was taken out on this home.
Original Mortgage
$772,745
Outstanding Balance
$619,500
Interest Rate
3.46%
Mortgage Type
Purchase Money Mortgage
Estimated Equity
$364,862
Purchase Details
Closed on
Sep 30, 2015
Sold by
Rabot Bruce and Rabot Donald
Bought by
Real Property Llc
Create a Home Valuation Report for This Property
The Home Valuation Report is an in-depth analysis detailing your home's value as well as a comparison with similar homes in the area
Home Values in the Area
Average Home Value in this Area
Purchase History
| Date | Buyer | Sale Price | Title Company |
|---|---|---|---|
| Colon Keto | $787,000 | -- | |
| Real Property Llc | $415,000 | -- |
Source: Public Records
Mortgage History
| Date | Status | Borrower | Loan Amount |
|---|---|---|---|
| Open | Colon Keto | $772,745 |
Source: Public Records
Tax History
| Year | Tax Paid | Tax Assessment Tax Assessment Total Assessment is a certain percentage of the fair market value that is determined by local assessors to be the total taxable value of land and additions on the property. | Land | Improvement |
|---|---|---|---|---|
| 2025 | $7,276 | $36,785 | $8,907 | $27,878 |
| 2024 | $7,276 | $36,228 | $9,303 | $26,925 |
| 2023 | $6,865 | $34,180 | $8,597 | $25,583 |
| 2022 | $6,437 | $52,800 | $14,760 | $38,040 |
| 2021 | $6,451 | $48,780 | $14,760 | $34,020 |
| 2020 | $6,489 | $53,640 | $14,760 | $38,880 |
| 2019 | $6,315 | $48,900 | $14,760 | $34,140 |
| 2018 | $5,806 | $28,483 | $10,616 | $17,867 |
| 2017 | $5,478 | $26,872 | $10,628 | $16,244 |
| 2016 | $5,107 | $26,872 | $10,628 | $16,244 |
| 2015 | $1,702 | $25,545 | $13,489 | $12,056 |
| 2014 | $1,702 | $25,159 | $15,936 | $9,223 |
Source: Public Records
Map
Nearby Homes
- 7817 64th St
- 62-16 80th Ave
- 78-14 64th Place
- 60-48 80th Ave
- 60-38 78th Ave
- 75-16 62nd St
- 647 Cooper Ave
- 6027 78th Ave
- 7520 64th Place
- 62-22 80th Rd
- 62-53 80th Rd
- 7535 60th Place
- 6020 Saint Felix Ave
- 60-27 Saint Felix Ave
- 6252 80th Rd
- 8018 64th Ln
- 5922 Cooper Ave
- 7818 65th St
- 58-59 78th Ave
- 8010 59th St
Your Personal Tour Guide
Ask me questions while you tour the home.