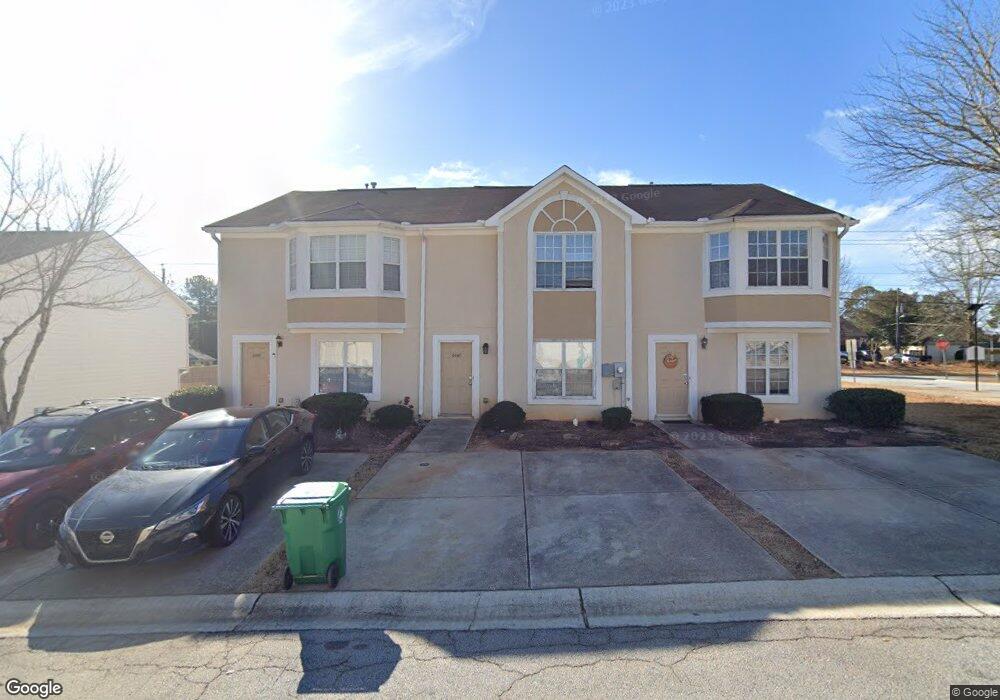
6067 Chupp Way Ln Stonecrest, GA 30038
Estimated Value: $152,795 - $180,000
3
Beds
3
Baths
1,212
Sq Ft
$134/Sq Ft
Est. Value
About This Home
This home is located at 6067 Chupp Way Ln, Stonecrest, GA 30038 and is currently estimated at $161,949, approximately $133 per square foot. 6067 Chupp Way Ln is a home located in DeKalb County with nearby schools including Flat Rock Elementary School, Lithonia Middle School, and Lithonia High School.
Ownership History
Date
Name
Owned For
Owner Type
Purchase Details
Closed on
Dec 4, 2019
Sold by
Resi Sfr Sub Llc
Bought by
Fyr Sfr Borrower Llc
Current Estimated Value
Purchase Details
Closed on
Jan 23, 2018
Sold by
Rcm Fund 1 Owner Llc
Bought by
Resi Sfr Sub Llc
Purchase Details
Closed on
Jun 6, 2017
Sold by
Kirk Karen
Bought by
Rcm Fund 1 Owner Llc
Purchase Details
Closed on
May 30, 2008
Sold by
Grant Tiffany Y
Bought by
Kirk Karen and Harris Michael
Home Financials for this Owner
Home Financials are based on the most recent Mortgage that was taken out on this home.
Original Mortgage
$106,295
Interest Rate
5.96%
Mortgage Type
FHA
Purchase Details
Closed on
Jun 27, 2002
Sold by
Sunrise Builders Inc
Bought by
Grant Tiffany Y
Home Financials for this Owner
Home Financials are based on the most recent Mortgage that was taken out on this home.
Original Mortgage
$85,850
Interest Rate
6.79%
Mortgage Type
New Conventional
Create a Home Valuation Report for This Property
The Home Valuation Report is an in-depth analysis detailing your home's value as well as a comparison with similar homes in the area
Home Values in the Area
Average Home Value in this Area
Purchase History
| Date | Buyer | Sale Price | Title Company |
|---|---|---|---|
| Fyr Sfr Borrower Llc | -- | -- | |
| Fyr Sfr Borrower Llc | -- | -- | |
| Resi Sfr Sub Llc | $86,000 | -- | |
| Resi Sfr Sub Llc | $86,000 | -- | |
| Rcm Fund 1 Owner Llc | $50,500 | -- | |
| Rcm Fund 1 Owner Llc | $50,500 | -- | |
| Kirk Karen | $108,000 | -- | |
| Kirk Karen | $108,000 | -- | |
| Grant Tiffany Y | $90,400 | -- | |
| Grant Tiffany Y | $90,400 | -- |
Source: Public Records
Mortgage History
| Date | Status | Borrower | Loan Amount |
|---|---|---|---|
| Previous Owner | Kirk Karen | $106,295 | |
| Previous Owner | Grant Tiffany Y | $85,850 |
Source: Public Records
Tax History Compared to Growth
Tax History
| Year | Tax Paid | Tax Assessment Tax Assessment Total Assessment is a certain percentage of the fair market value that is determined by local assessors to be the total taxable value of land and additions on the property. | Land | Improvement |
|---|---|---|---|---|
| 2025 | $3,359 | $65,560 | $9,834 | $55,726 |
| 2024 | $3,333 | $65,560 | $9,834 | $55,726 |
| 2023 | $3,333 | $65,560 | $10,000 | $55,560 |
| 2022 | $2,727 | $54,920 | $7,200 | $47,720 |
| 2021 | $1,848 | $34,400 | $7,224 | $27,176 |
| 2020 | $1,833 | $34,400 | $7,224 | $27,176 |
| 2019 | $1,823 | $34,400 | $7,200 | $27,200 |
| 2018 | $938 | $23,360 | $4,800 | $18,560 |
| 2017 | $653 | $21,000 | $4,800 | $16,200 |
| 2016 | $465 | $15,960 | $2,440 | $13,520 |
| 2014 | $369 | $12,880 | $2,440 | $10,440 |
Source: Public Records
Map
Nearby Homes
- 3127 Fields Dr
- 2960 Fields Dr
- 3047 Fields Dr
- 2900 Parc Lorraine
- 2914 Parc Lorraine
- 2968 Fields Dr
- 2936 Parc Lorraine
- 5933 Trent Walk Dr
- 3011 Fields Dr
- 2968
- 5980 Sherwood Ct
- 3078 Parc Lorraine
- 5902 Trent Walk Dr
- 3100 Parc Lorraine Unit 3100
- 5867 Trent Walk Dr
- 6003 Sherwood Trace
- 5860 Trent Walk Dr
- 167 Tiburon Dr
- 2722 Penwood Place
- 2559 Piering Dr
- 6067 Chupp Way Ln
- 0 Chupp Way Ln Unit 7563981
- 6065 Chupp Way Ln
- 6069 Chupp Way Ln Unit 10
- 6069 Chupp Way Ln
- 6069 Chupp
- 6069 Chupp Unit 6069
- 6071 Chupp Way Ln
- 6073 Chupp Way Ln
- 6075 Chupp Way Ln
- 5099 Chupp Way Cir
- 5101 Chupp Way Cir
- 5097 Chupp Way Cir Unit 49
- 5097 Chupp Way Cir
- 6070 Chupp Way Ln
- 5095 Chupp Way Cir
- 5088 Chupp Way Cir
- 5093 Chupp Way Cir
- 6072 Chupp Way Ln
- 6077 Chupp Way Ln