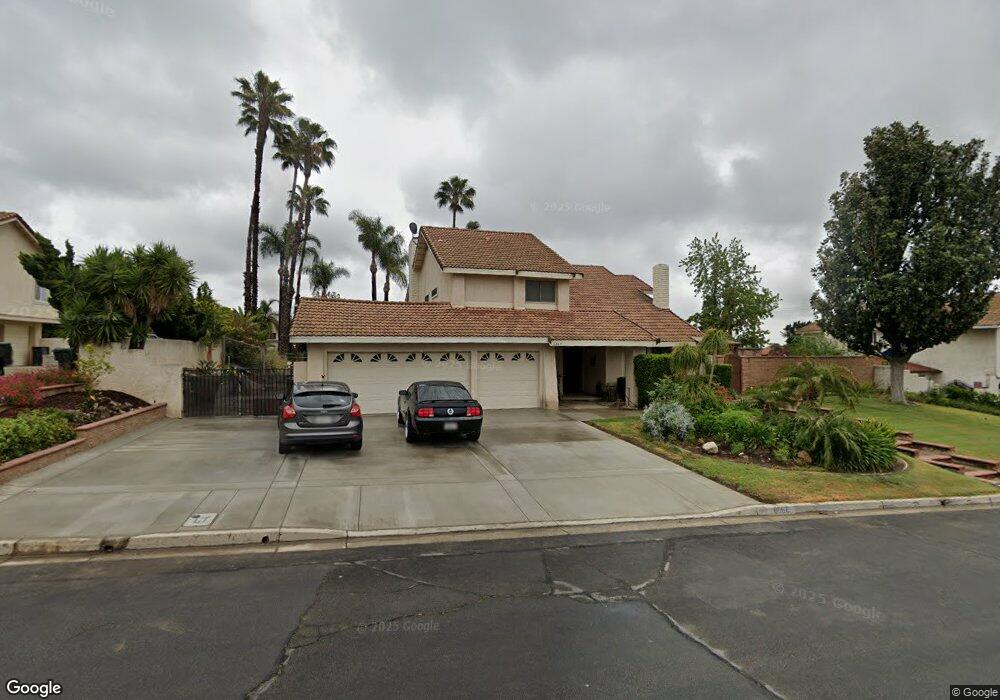
6067 Indigo Ave Rancho Cucamonga, CA 91701
Estimated Value: $1,085,000 - $1,258,000
4
Beds
3
Baths
2,294
Sq Ft
$501/Sq Ft
Est. Value
About This Home
This home is located at 6067 Indigo Ave, Rancho Cucamonga, CA 91701 and is currently estimated at $1,150,129, approximately $501 per square foot. 6067 Indigo Ave is a home located in San Bernardino County with nearby schools including Floyd M. Stork Elementary, Alta Loma Junior High, and Alta Loma High.
Ownership History
Date
Name
Owned For
Owner Type
Purchase Details
Closed on
Aug 23, 2010
Sold by
Craig Sherri A
Bought by
Craig David B
Current Estimated Value
Home Financials for this Owner
Home Financials are based on the most recent Mortgage that was taken out on this home.
Original Mortgage
$426,280
Outstanding Balance
$281,241
Interest Rate
4.5%
Mortgage Type
FHA
Estimated Equity
$868,888
Purchase Details
Closed on
Jul 29, 2010
Sold by
Ellis Ronald
Bought by
Craig David B
Home Financials for this Owner
Home Financials are based on the most recent Mortgage that was taken out on this home.
Original Mortgage
$426,280
Outstanding Balance
$281,241
Interest Rate
4.5%
Mortgage Type
FHA
Estimated Equity
$868,888
Purchase Details
Closed on
Dec 27, 2002
Sold by
Ellis Michelle
Bought by
Ellis Ronald
Home Financials for this Owner
Home Financials are based on the most recent Mortgage that was taken out on this home.
Original Mortgage
$332,000
Interest Rate
5.96%
Mortgage Type
Stand Alone First
Purchase Details
Closed on
Dec 4, 2002
Sold by
Strack Rushing Shelly J
Bought by
Ellis Ronald
Home Financials for this Owner
Home Financials are based on the most recent Mortgage that was taken out on this home.
Original Mortgage
$332,000
Interest Rate
5.96%
Mortgage Type
Stand Alone First
Purchase Details
Closed on
Oct 9, 2001
Sold by
Drinkall John L and Drinkall Denyce
Bought by
Strack Rushing Shelly J
Home Financials for this Owner
Home Financials are based on the most recent Mortgage that was taken out on this home.
Original Mortgage
$274,000
Interest Rate
6.87%
Purchase Details
Closed on
Nov 1, 1994
Sold by
Tisai Randall H and Tisai Barbara J
Bought by
Drinkall John L and Drinkall Denyce
Home Financials for this Owner
Home Financials are based on the most recent Mortgage that was taken out on this home.
Original Mortgage
$224,900
Interest Rate
8.91%
Purchase Details
Closed on
Jul 14, 1994
Sold by
Tisai Randy H and Tisai Barbara J
Bought by
Tisai Randall H and Tisai Barbara J
Purchase Details
Closed on
Jan 24, 1994
Sold by
Wells Fargo Bank Na
Bought by
Tisai Randy H and Tisai Barbara J
Home Financials for this Owner
Home Financials are based on the most recent Mortgage that was taken out on this home.
Original Mortgage
$177,300
Interest Rate
6.98%
Purchase Details
Closed on
Sep 24, 1993
Sold by
American Securities Company
Bought by
Wells Fargo Bank Na
Create a Home Valuation Report for This Property
The Home Valuation Report is an in-depth analysis detailing your home's value as well as a comparison with similar homes in the area
Home Values in the Area
Average Home Value in this Area
Purchase History
| Date | Buyer | Sale Price | Title Company |
|---|---|---|---|
| Craig David B | -- | Multiple | |
| Craig David B | $440,000 | Chicago Title Company | |
| Ellis Ronald | -- | Fidelity National Title | |
| Ellis Ronald | $415,000 | Fidelity National Title | |
| Strack Rushing Shelly J | $342,500 | Fidelity National Title Ins | |
| Drinkall John L | $250,000 | Commonwealth Land Title Co | |
| Tisai Randall H | -- | -- | |
| Tisai Randy H | $197,000 | Old Republic Title Company | |
| Wells Fargo Bank Na | $115,682 | Gateway Title Company |
Source: Public Records
Mortgage History
| Date | Status | Borrower | Loan Amount |
|---|---|---|---|
| Open | Craig David B | $426,280 | |
| Previous Owner | Ellis Ronald | $332,000 | |
| Previous Owner | Strack Rushing Shelly J | $274,000 | |
| Previous Owner | Drinkall John L | $224,900 | |
| Previous Owner | Tisai Randy H | $177,300 |
Source: Public Records
Tax History Compared to Growth
Tax History
| Year | Tax Paid | Tax Assessment Tax Assessment Total Assessment is a certain percentage of the fair market value that is determined by local assessors to be the total taxable value of land and additions on the property. | Land | Improvement |
|---|---|---|---|---|
| 2025 | $6,022 | $563,719 | $197,302 | $366,417 |
| 2024 | $6,022 | $552,665 | $193,433 | $359,232 |
| 2023 | $5,885 | $541,828 | $189,640 | $352,188 |
| 2022 | $5,869 | $531,204 | $185,922 | $345,282 |
| 2021 | $5,866 | $520,788 | $182,276 | $338,512 |
| 2020 | $12,490 | $515,448 | $180,407 | $335,041 |
| 2019 | $12,553 | $505,342 | $176,870 | $328,472 |
| 2018 | $12,424 | $495,433 | $173,402 | $322,031 |
| 2017 | $12,128 | $485,719 | $170,002 | $315,717 |
| 2016 | $11,953 | $476,195 | $166,669 | $309,526 |
| 2015 | $11,964 | $469,042 | $164,165 | $304,877 |
| 2014 | $11,818 | $459,854 | $160,949 | $298,905 |
Source: Public Records
Map
Nearby Homes
- 8093 Banyan St
- 8010 Rosebud St
- 7950 Gardenia Ave
- 5800 Ridgeway Rd
- 8291 Jennet St
- 6114 Sard St
- 6113 Sard St
- 7931 Beechwood Dr
- 6073 Cameo St
- 880 E 24th St
- 6165 Hollyoak Dr
- 2421 Cliff Rd
- 8309 Hillside Rd
- 477 Paxton Ct
- 1267 Kendra Ln
- 2479 Cliff Rd
- 2487 Cliff Rd
- 1855 Ambrosia Ave
- 8337 Jade Dr
- 6441 Napa Ave
- 6087 Indigo Ave
- 6057 Indigo Ave
- 6066 Della Ave
- 6047 Indigo Ave
- 6056 Della Ave
- 6086 Della Ave
- 6066 Indigo Ave
- 6086 Indigo Ave
- 6046 Della Ave
- 6056 Indigo Ave
- 6041 Indigo Ave
- 8017 Banyan St
- 8033 Banyan St
- 6046 Indigo Ave
- 6040 Della Ave
- 8049 Banyan St
- 6040 Indigo Ave
- 6067 Della Ave
- 8065 Banyan St
- 8007 Rosebud St