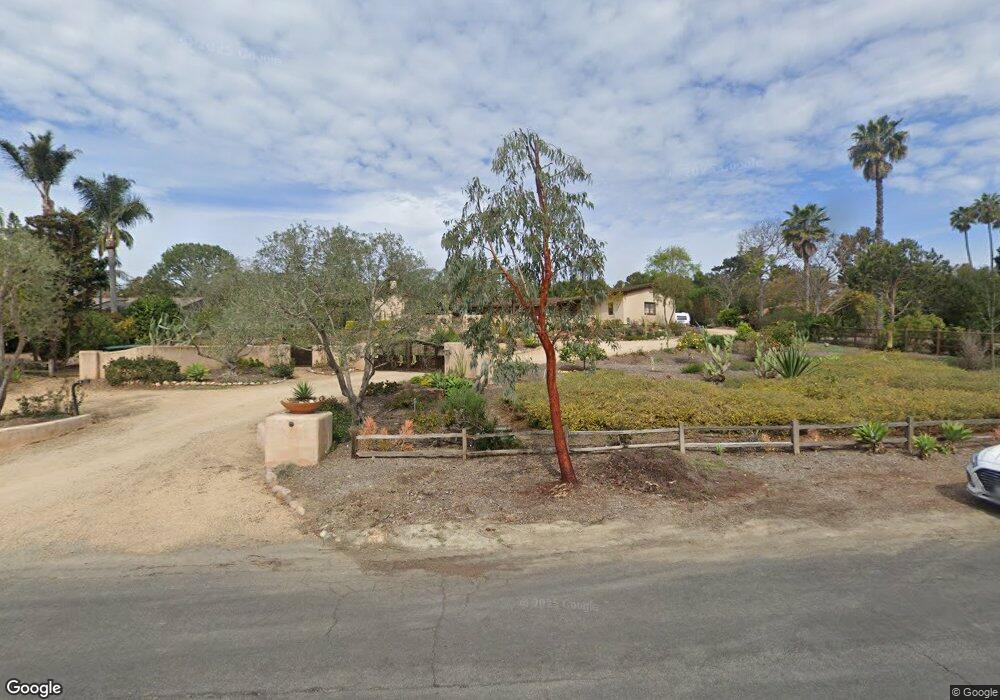
6068 Mimulus Rancho Santa Fe, CA 92067
Estimated Value: $3,422,000 - $4,559,000
2
Beds
3
Baths
3,460
Sq Ft
$1,120/Sq Ft
Est. Value
About This Home
This home is located at 6068 Mimulus, Rancho Santa Fe, CA 92067 and is currently estimated at $3,875,102, approximately $1,119 per square foot. 6068 Mimulus is a home with nearby schools including R. Roger Rowe Elementary School, Torrey Pines High School, and Horizon Prep.
Ownership History
Date
Name
Owned For
Owner Type
Purchase Details
Closed on
Mar 23, 1999
Sold by
Elizabeth B Wohlford Burnet B Mwso
Bought by
Dizio Steven F and Dizio Helen L
Current Estimated Value
Home Financials for this Owner
Home Financials are based on the most recent Mortgage that was taken out on this home.
Original Mortgage
$617,500
Outstanding Balance
$146,265
Interest Rate
6.5%
Estimated Equity
$3,728,837
Purchase Details
Closed on
Jul 28, 1994
Sold by
Wohlford Burnet B and Wohlford Elizabeth B
Bought by
Wohlford Burnet B and Wohlford Elizabeth B
Home Financials for this Owner
Home Financials are based on the most recent Mortgage that was taken out on this home.
Original Mortgage
$420,000
Interest Rate
8.38%
Purchase Details
Closed on
Dec 20, 1989
Create a Home Valuation Report for This Property
The Home Valuation Report is an in-depth analysis detailing your home's value as well as a comparison with similar homes in the area
Home Values in the Area
Average Home Value in this Area
Purchase History
| Date | Buyer | Sale Price | Title Company |
|---|---|---|---|
| Dizio Steven F | -- | First American Title | |
| Wohlford Elizabeth B | -- | First American Title | |
| Wohlford Burnet B | -- | Stewart Title Company | |
| Wohlford Elizabeth B | -- | Stewart Title Company | |
| -- | $960,000 | -- |
Source: Public Records
Mortgage History
| Date | Status | Borrower | Loan Amount |
|---|---|---|---|
| Open | Dizio Steven F | $617,500 | |
| Previous Owner | Wohlford Burnet B | $420,000 |
Source: Public Records
Tax History
| Year | Tax Paid | Tax Assessment Tax Assessment Total Assessment is a certain percentage of the fair market value that is determined by local assessors to be the total taxable value of land and additions on the property. | Land | Improvement |
|---|---|---|---|---|
| 2025 | $21,931 | $1,976,997 | $1,175,783 | $801,214 |
| 2024 | $21,931 | $1,938,233 | $1,152,729 | $785,504 |
| 2023 | $21,320 | $1,900,229 | $1,130,127 | $770,102 |
| 2022 | $21,019 | $1,862,970 | $1,107,968 | $755,002 |
| 2021 | $20,667 | $1,826,443 | $1,086,244 | $740,199 |
| 2020 | $20,483 | $1,807,716 | $1,075,106 | $732,610 |
| 2019 | $20,104 | $1,772,272 | $1,054,026 | $718,246 |
| 2018 | $19,840 | $1,737,522 | $1,033,359 | $704,163 |
| 2017 | $19,505 | $1,703,454 | $1,013,098 | $690,356 |
| 2016 | $18,838 | $1,670,054 | $993,234 | $676,820 |
| 2015 | $18,518 | $1,644,969 | $978,315 | $666,654 |
| 2014 | $18,161 | $1,612,748 | $959,152 | $653,596 |
Source: Public Records
Map
Nearby Homes
- 6009 Mimulus
- 6141 Lago Lindo
- 6150 La Fremontia
- 5725 Loma Verde Dr
- 5618 Loma Verde Dr
- 6129 La Flecha
- 6152 Camino Selva
- 17912 El Brazo Lot 77
- 6347 Las Colinas
- 16902 Via de Santa fe Unit 11
- 6710 El Montevideo
- 6710 El Montevideo
- 5929 Linea Del Cielo Unit Jacaranda
- 5927 Linea Del Cielo Unit Elm
- 6525 Lago Lindo
- 5471 73 La Crescenta
- 6449 Las Colinas
- 17845 Via de Fortuna
- 6870 La Valle Plateada
- 17872 Via de Fortuna
Your Personal Tour Guide
Ask me questions while you tour the home.