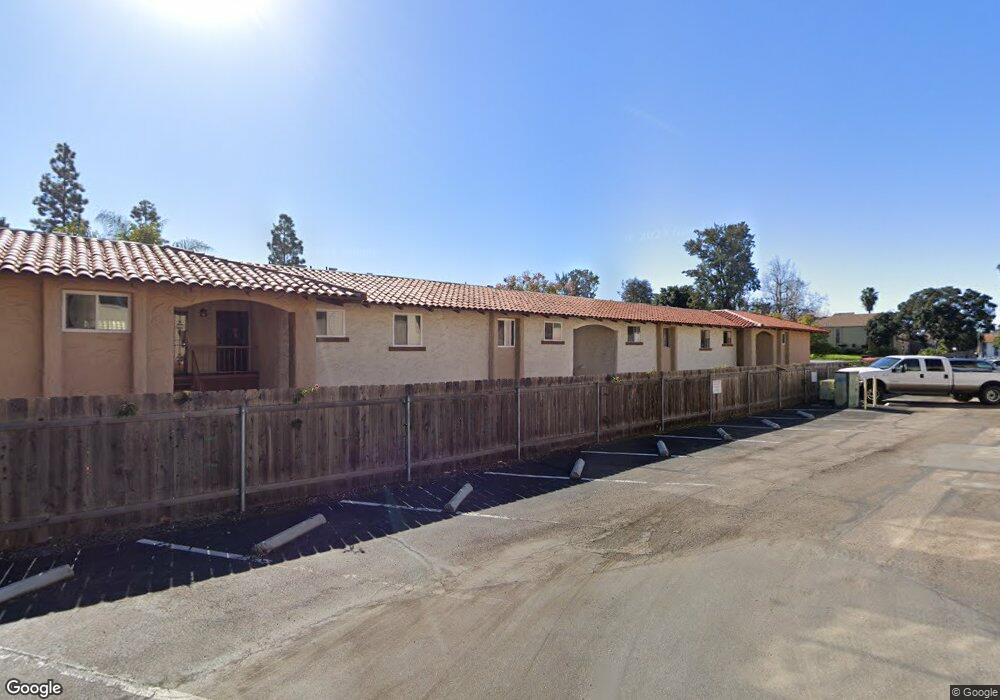
6069 Rancho Mission Rd Unit 204 San Diego, CA 92108
Grantville NeighborhoodEstimated Value: $499,091 - $550,000
2
Beds
2
Baths
834
Sq Ft
$627/Sq Ft
Est. Value
About This Home
This home is located at 6069 Rancho Mission Rd Unit 204, San Diego, CA 92108 and is currently estimated at $522,523, approximately $626 per square foot. 6069 Rancho Mission Rd Unit 204 is a home located in San Diego County with nearby schools including Juarez Elementary School, Foster Elementary School, and Taft Middle School.
Ownership History
Date
Name
Owned For
Owner Type
Purchase Details
Closed on
Aug 19, 2015
Sold by
Melo Marcia
Bought by
Yingst Bryan S
Current Estimated Value
Home Financials for this Owner
Home Financials are based on the most recent Mortgage that was taken out on this home.
Original Mortgage
$284,773
Outstanding Balance
$222,978
Interest Rate
3.9%
Mortgage Type
VA
Estimated Equity
$299,545
Purchase Details
Closed on
Dec 12, 2003
Sold by
Melo Marcia and Melo Marcia A
Bought by
Melo Marcia
Home Financials for this Owner
Home Financials are based on the most recent Mortgage that was taken out on this home.
Original Mortgage
$110,000
Interest Rate
5.97%
Mortgage Type
Purchase Money Mortgage
Purchase Details
Closed on
Oct 31, 1990
Purchase Details
Closed on
Aug 20, 1985
Purchase Details
Closed on
Jan 26, 1984
Create a Home Valuation Report for This Property
The Home Valuation Report is an in-depth analysis detailing your home's value as well as a comparison with similar homes in the area
Home Values in the Area
Average Home Value in this Area
Purchase History
| Date | Buyer | Sale Price | Title Company |
|---|---|---|---|
| Yingst Bryan S | $280,000 | Chicago Title | |
| Melo Marcia | -- | Fidelity National Title Co | |
| -- | $98,000 | -- | |
| -- | $85,000 | -- | |
| -- | $82,000 | -- |
Source: Public Records
Mortgage History
| Date | Status | Borrower | Loan Amount |
|---|---|---|---|
| Open | Yingst Bryan S | $284,773 | |
| Previous Owner | Melo Marcia | $110,000 |
Source: Public Records
Tax History Compared to Growth
Tax History
| Year | Tax Paid | Tax Assessment Tax Assessment Total Assessment is a certain percentage of the fair market value that is determined by local assessors to be the total taxable value of land and additions on the property. | Land | Improvement |
|---|---|---|---|---|
| 2025 | $3,937 | $331,454 | $220,481 | $110,973 |
| 2024 | $3,937 | $324,956 | $216,158 | $108,798 |
| 2023 | $3,848 | $318,585 | $211,920 | $106,665 |
| 2022 | $3,744 | $312,339 | $207,765 | $104,574 |
| 2021 | $3,717 | $306,216 | $203,692 | $102,524 |
| 2020 | $3,672 | $303,077 | $201,604 | $101,473 |
| 2019 | $3,605 | $297,135 | $197,651 | $99,484 |
| 2018 | $3,370 | $291,310 | $193,776 | $97,534 |
| 2017 | $80 | $285,599 | $189,977 | $95,622 |
| 2016 | $3,234 | $280,000 | $186,252 | $93,748 |
| 2015 | $1,673 | $147,051 | $97,816 | $49,235 |
| 2014 | $1,646 | $144,171 | $95,900 | $48,271 |
Source: Public Records
Map
Nearby Homes
- 10505 San Diego Mission Rd Unit 434-041-06-00
- 6069 Rancho Mission Rd Unit 105
- 6111 Rancho Mission Rd Unit 209
- 6111 Rancho Mission Rd Unit 203
- 6131 Rancho Mission Rd Unit 211
- 6131 Rancho Mission Rd Unit 101
- 6131 Rancho Mission Rd Unit 113
- 10669 San Diego Mission Rd Unit 203
- 10402 Harlow Cir Unit 43
- 6171 Rancho Mission Rd Unit 103
- 5910 Rancho Mission Rd Unit 37
- 5910 Rancho Mission Rd Unit 27
- 10400 Caminito Cuervo Unit 260
- 10400 Caminito Cuervo Unit 273
- 5906 Rancho Mission Rd Unit 22
- 5962 Rancho Mission Rd Unit 222
- 10350 Caminito Cuervo Unit 93
- 10425 Caminito Cuervo Unit 216
- 5938 Rancho Mission Rd Unit 133
- 6255 Rancho Mission Rd Unit 217
- 6069 Rancho Mission Rd Unit 103
- 6069 Rancho Mission Rd Unit 201
- 6069 Rancho Mission Rd Unit 203
- 6069 Rancho Mission Rd
- 6069 Rancho Mission Rd Unit 106
- 6069 Rancho Mission Rd Unit 104
- 6069 Rancho Mission Rd Unit 205
- 6069 Rancho Mission Rd Unit 202
- 6069 Rancho Mission Rd Unit 101
- 6069 Rancho Mission Rd Unit 206
- 6069 Rancho Mission Rd Unit 201
- 6069 Rancho Mission Rd Unit 202
- 6069 Rancho Mission Rd Unit 201
- 6069 Rancho Mission Rd Unit 106
- 6069 Rancho Mission Rd Unit 105
- 6069 Rancho Mission Rd Unit 104
- 6069 Rancho Mission Rd Unit 103
- 6069 Rancho Mission Rd Unit 102
- 6069 Rancho Mission Rd Unit 101
- 6069 Rancho Mission Rd Unit 206